Maker Pro
Maker Pro

Question about active low pass filtering

Chen Ron

Mar 29, 2018
1
Joined
Mar 29, 2018
Messages
1
hello :) trying to analyze a circuit and couldn't understand this part of the circuit, in the description of the circuit it says its an active low pass filter. can anyone help me with analyzing this circuit? THANKS :)
 

Attachments

  • circuit1.pdf
    32.1 KB · Views: 51

LvW

Apr 12, 2014
604
Joined
Apr 12, 2014
Messages
604
There are three points to be answered:
* Is there any negative DC feedback (stable bias point)?
* What about the gain for low frequencies?
* What about the gain for rising (that means: high) freqiencies?
 

Audioguru

Sep 24, 2016
3,656
Joined
Sep 24, 2016
Messages
3,656
1) The negative DC feedback is obvious.
2) The gain for low frequencies is not affected by the 5n6 and 560p capacitors.
3) "Gain for rising" might be talking about Easter. The mid audio frequencies in this filter are shown to rise only 2dB in my simulation:
 

Attachments

  • inverting active lowpass filter.png
    inverting active lowpass filter.png
    25.1 KB · Views: 113

Ratch

Mar 10, 2013
1,099
Joined
Mar 10, 2013
Messages
1,099
hello :) trying to analyze a circuit and couldn't understand this part of the circuit, in the description of the circuit it says its an active low pass filter. can anyone help me with analyzing this circuit? THANKS :)

OK, first I will do an analysis of the circuit using LaPlace transforms, and then I will check the results with a CAD program.

The four simultaneous equations for the frequency analysis are as follows:
ChenRonA.JPG

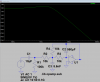
The Bode plot of vout/vin is:

ChenRonB.JPG
And, the Bode plot of the CAD program is:

ChenRonC.JPG
Notice that the x-axis of the first Bode plot in radians and the x-axis of the CAD program is in hertz. Ask if you have any questions of how the solution was derived.

Ratch
 

Audioguru

Sep 24, 2016
3,656
Joined
Sep 24, 2016
Messages
3,656
The Bode plot of Vout/Vin has a peak at 4.3kHz and a slope of 12dB/octave. Why radians?
The CAD plot has a peak at 7kHz and a slope of 12dB/octave.
LTspice has a peak at 1.3kHz and a slope at 6dB/octave.
Which one is correct??
 

Ratch

Mar 10, 2013
1,099
Joined
Mar 10, 2013
Messages
1,099
The Bode plot of Vout/Vin has a peak at 4.3kHz and a slope of 12dB/octave. Why radians?

The peak of Vout/Vin has a peak of 44000 radians = 7 kHz. The slope drops 30 dB from 10 kHz to 50 kHz. So, 10 2^x = 50 . x = 2.32 . The slope is 30/2.32 = 12.92 dB/octave. Radians is what my plotting routine does. I have not figured out to make it do Hz yet.

The CAD plot has a peak at 7kHz and a slope of 12dB/octave.

The peak of the CAD is 7 kHz. The slope drops 30 dB from 10 kHz to 50 kHz. So the figures are the same as above for 12,92 dB/octive

LTspice has a peak at 1.3kHz and a slope at 6dB/octave.

The peak of Ltspice is 1.3 kHz. I figure the slope to be 5.45 dB/octave.

Which one is correct??

I think all presentations are correct. I suspect LTspice did not use an ideal op-amp like I did. I will leave it up to you to check and see. I have great confidence in my calculations for an ideal op-amp.

Ratch
 

Audioguru

Sep 24, 2016
3,656
Joined
Sep 24, 2016
Messages
3,656
Almost any opamp works fine at 7kHz except a lousy LM324 and LM358. I doubt if LTspice would consider a 50 years old 741 opamp that has trouble above 9kHz.
 

Ratch

Mar 10, 2013
1,099
Joined
Mar 10, 2013
Messages
1,099
Almost any opamp works fine at 7kHz except a lousy LM324 and LM358. I doubt if LTspice would consider a 50 years old 741 opamp that has trouble above 9kHz.

I would check LTspice and see what parameters they are using. My manual derivation of the Bode plot and the CAD program seem to agree with each other.

Ratch
 

WHONOES

May 20, 2017
1,217
Joined
May 20, 2017
Messages
1,217
I have tried it out on my trusty simulator using a TL071 and an Ideal opamp getting very similar results. They vary a little from what others have done.
See attached plot.
 

Attachments

  • Filter Bode Plot.pdf
    40.4 KB · Views: 42
Top