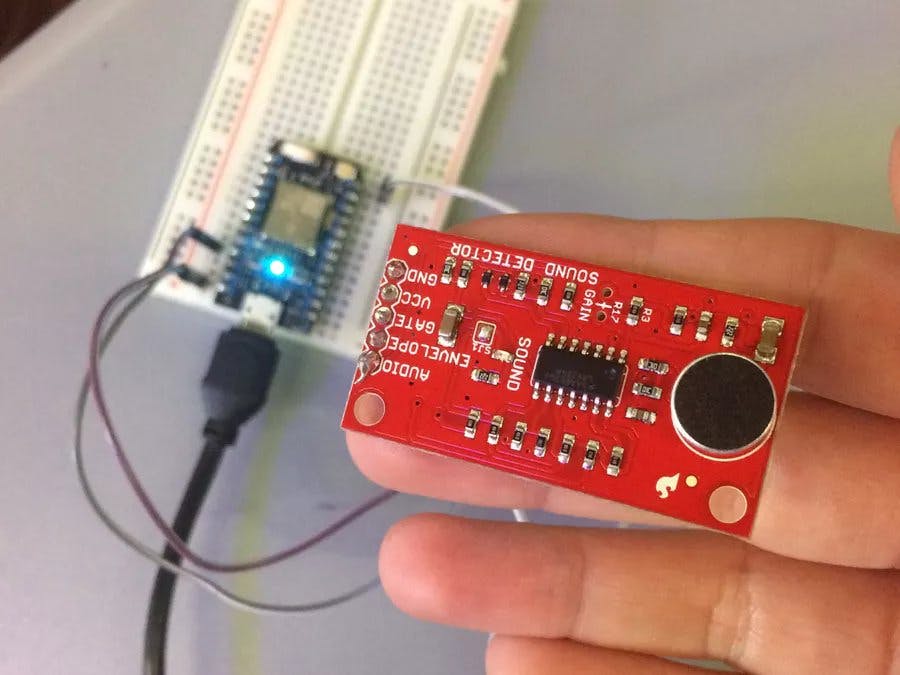
This project will teach you how to build a photon that collects sound levels using the SparkFun Sound Detector.
This project is for Lane of Things; a smaller version of Array of Things which is described as, "an urban sensing project, a network of interactive, modular sensor boxes that will be installed around Chicago to collect real-time data on the city’s environment, infrastructure, and activity for research and public use."
We are studying the relationship between sound levels and time during the day. Does sound increase as the time gets closer to the school day ending? And if not what makes certain periods louder than others?
This is interesting because the week that we collected data had a different schedule everyday. The first day was shorter classes, the second skipped periods 4, 5, and 6, then another day of shorter classes, and finally the next day was all testing with no periods.
Prototyping the Project
First, we prototyped using cardboard and paper. Our prototype used hot glue and tape to secure the sides and the cone together.
For the final product, we used a wood box as our enclosure. The box uses T-slots so that we can open and close the box when necessary. The box has 2 openings, one for the microphone of the sound sensor to stick out of, and the other for the power cord.
Attached on the box is a cone that we added to help direct the sound towards the microphone. We also engraved our contact information onto the box for anybody who had questions about what data we were collecting.
We had an issue with our breadboard fitting into the box because of a mistake with the size of the inside of the box compared to the size of the breadboard with the sensors attached. We fixed this problem by angling our breadboard inside of the box.
Laser cutting the sides of our box from Baltic Birch Plywood
We went through several variations of code throughout this project. The sound detector we used is relatively new and our main issue was that the average values were not always logical, and the minimum value sometimes surpassed the maximum. We also had to edit our Google Script Editor code so that we could pull our values from the photon to our spreadsheet. We did this by adding Particle variables that would be able to be accessed by a unique URL by the Script Editor.
We deployed our sensor in the front of a math class room. The classroom is on the 3rd floor of Lane tech and is used for the majority of the day including periods 1, 2, 3, 5, 7, and 8. The classroom is set up so that all of the desks are facing towards our sensor with the teacher lecturing at the front of the room adjacent to our sensor.
Our sensor under the whiteboard, attached by command strips and powered through an outlet.
We had originally wanted to determine if our peers are more likely to talk in the back of the room, or in the front of the room. We had to change our idea because the week that we collecting data was also the week of SAT testing which caused all the class schedules to be different. We felt that the combination of scheduling and moving the sensor would cause our data to be inaccurate.
We learned a lot about coding and the difference between pulling and pushing data. Each member of our group had coding experience but had not used the Particle platform before.
Data Collection Results
When we stopped collecting data we had over 150, 000 data points. We found that the average sound levels did increase throughout the day with spikes during the beginning and end of a class period. These same spikes are also seen in our minimum and maximum data, minimum barely changes while maximum has a spike for the start and end of each period.
There are also low points in our "Avg Sound Levels" graph during the middle of the class periods, especially from 10:45-1:25 which we believe is because many students leave the school for lunch.
We also noticed that each day had a higher average than the one before it. This shows that not only does the sound increase as the school day comes to an end, but also as the week comes to an end. When comparing data collected before and after school, we noticed that the graphs mirrored each other. The major spike in both graphs represents students rushing to class, and rushing to leave school. We were surprised that after school did not show a slower decline because we assumed that kids would stay longer to go to clubs or sports.