Water quality instruments are classified as precision scientific instruments. A simple design is proposed with a TCS3200 color sensor interfaced with a PIC16F13145 to measure common water quality parameters as pH, Cl, Br, and turbidity. TCS3200 use four control signals S0, S1, S2, S3 for frequency and color selection, hence the importance of CLB.
The Idea
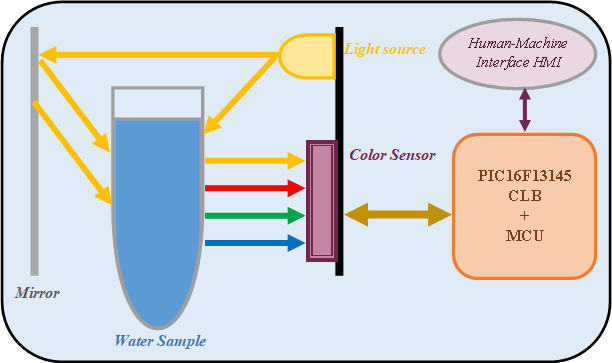
This project deal with the design of a simple spectrophotometer to assess water quality analysis and potability for domestic use. This device has a measurement accuracy that allows us to reliably assert values for pH, Chlorine CL, Bromine Br, and Turbidity.
The block diagram below describes the main device architecture. White LEDs are used as a light source to illuminate the water sample. The reflected light, the water's chemical properties. A first edition was build using Raspberry Pi and the Python programming language but timing is verry hard to acheeve in addition to the important cost.
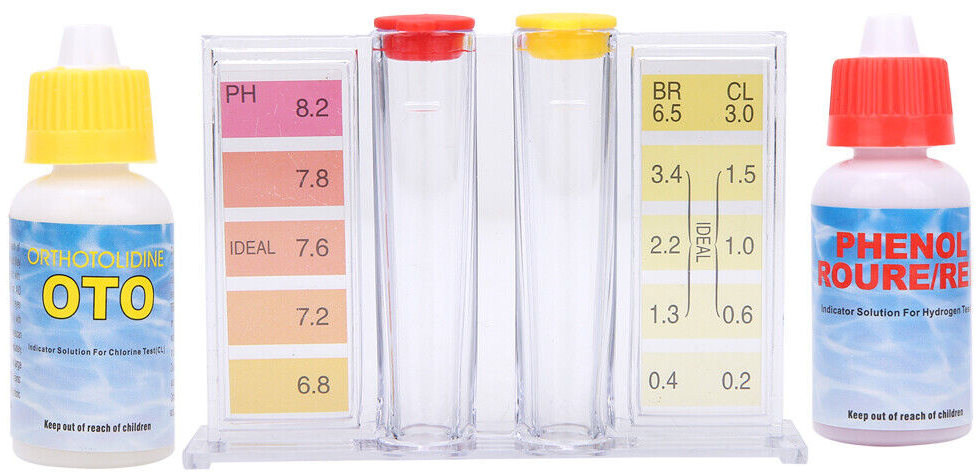
Water quality assessment is of interest to households, municipal water supply and treatment services, and environmental agencies. Manual measurement kits are widely used (figure below). In this project, I want to highlight the ease of use with measurement accuracy.
Turbidity is measured directly from the inserted water sample tube. However, for pH, we are using Phenol-red, and orthotolidine for cl/Br.
Example of manual kit used for water quality control
Hardware design
The design acts as an IoT solution so the hardware part includes three components: GY-31 module including a TCS3200 color sensor, PIC16F13145 curiosity nano development board, and a WiFi module.
The TCS3200 color sensor
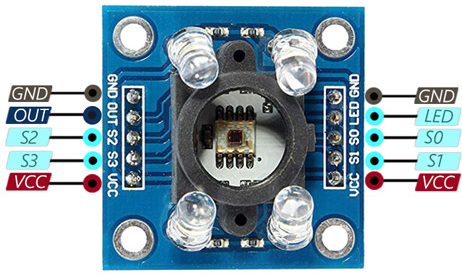
I'm using the GY-31 module, shown on the figure below, which includes a TCS3200 color sensor and four white LEDs. In addition to the power signals, VCC and GND. The detected color is expressed as a square signal frequency, 50% duty cycle on the OUT pin. This sensor has an 8x8 array of photodiodes, 16 with a red filter, 16 with a blue filter, 16 with a green filter, and the last 16 with no optical filter. It has four logical sensors to control S0 and S1 to control the frequency, S2 and S3 to select the desired color, as explained in the table below. More details can be found on the component datasheet.
The GY-31 module with powering and conrol signals.
Connection with PIC16F13145 Curiosity Nano
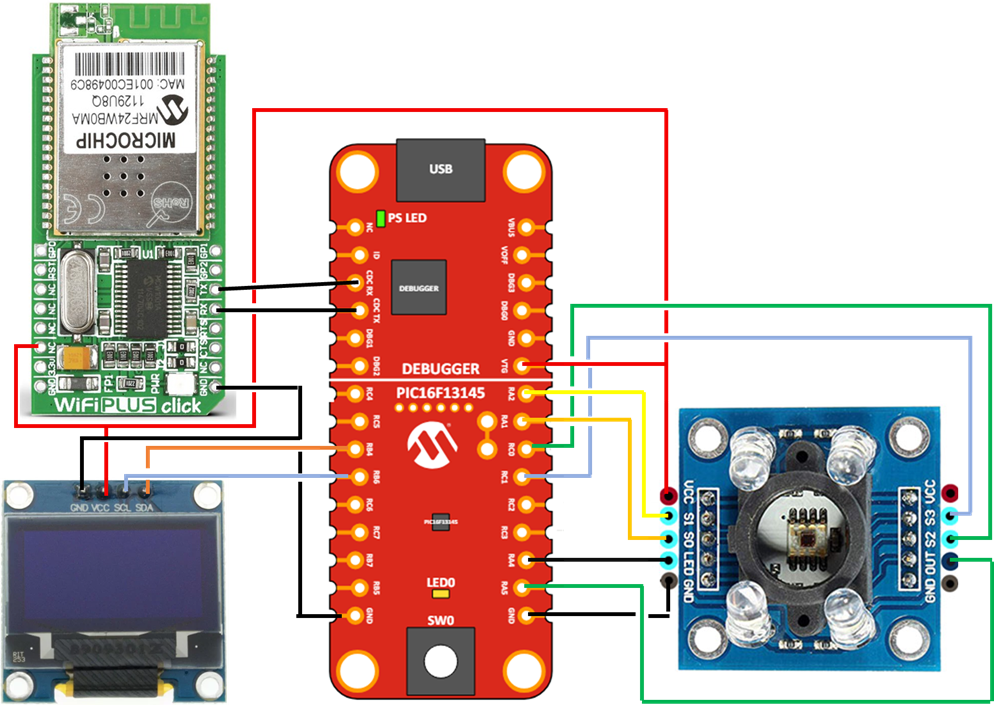
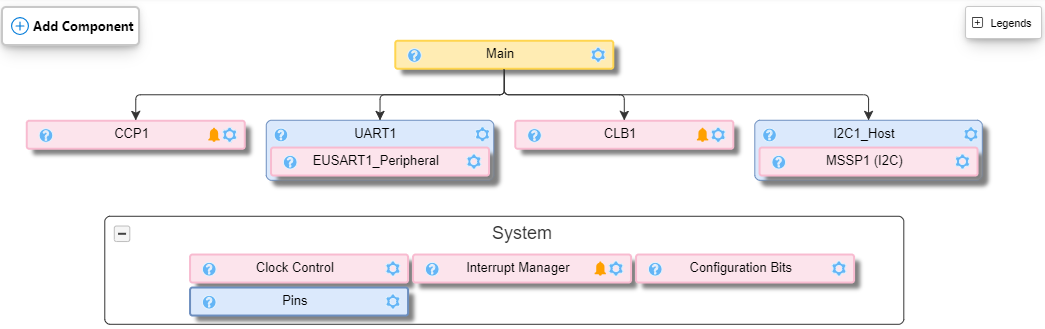
The Schematic below describes all components used within this project and how they are connected with the PIC16f13145 Curiosity nano.
Schematic of the designed solution
We are facing several developement challenges:
- Driver for the OLED SSD1306 to display text with reduced RAM usage.
- Driver for the WiFi Click board.
- Driver for GY-31 color sensor.
- CLB executing the State machine.
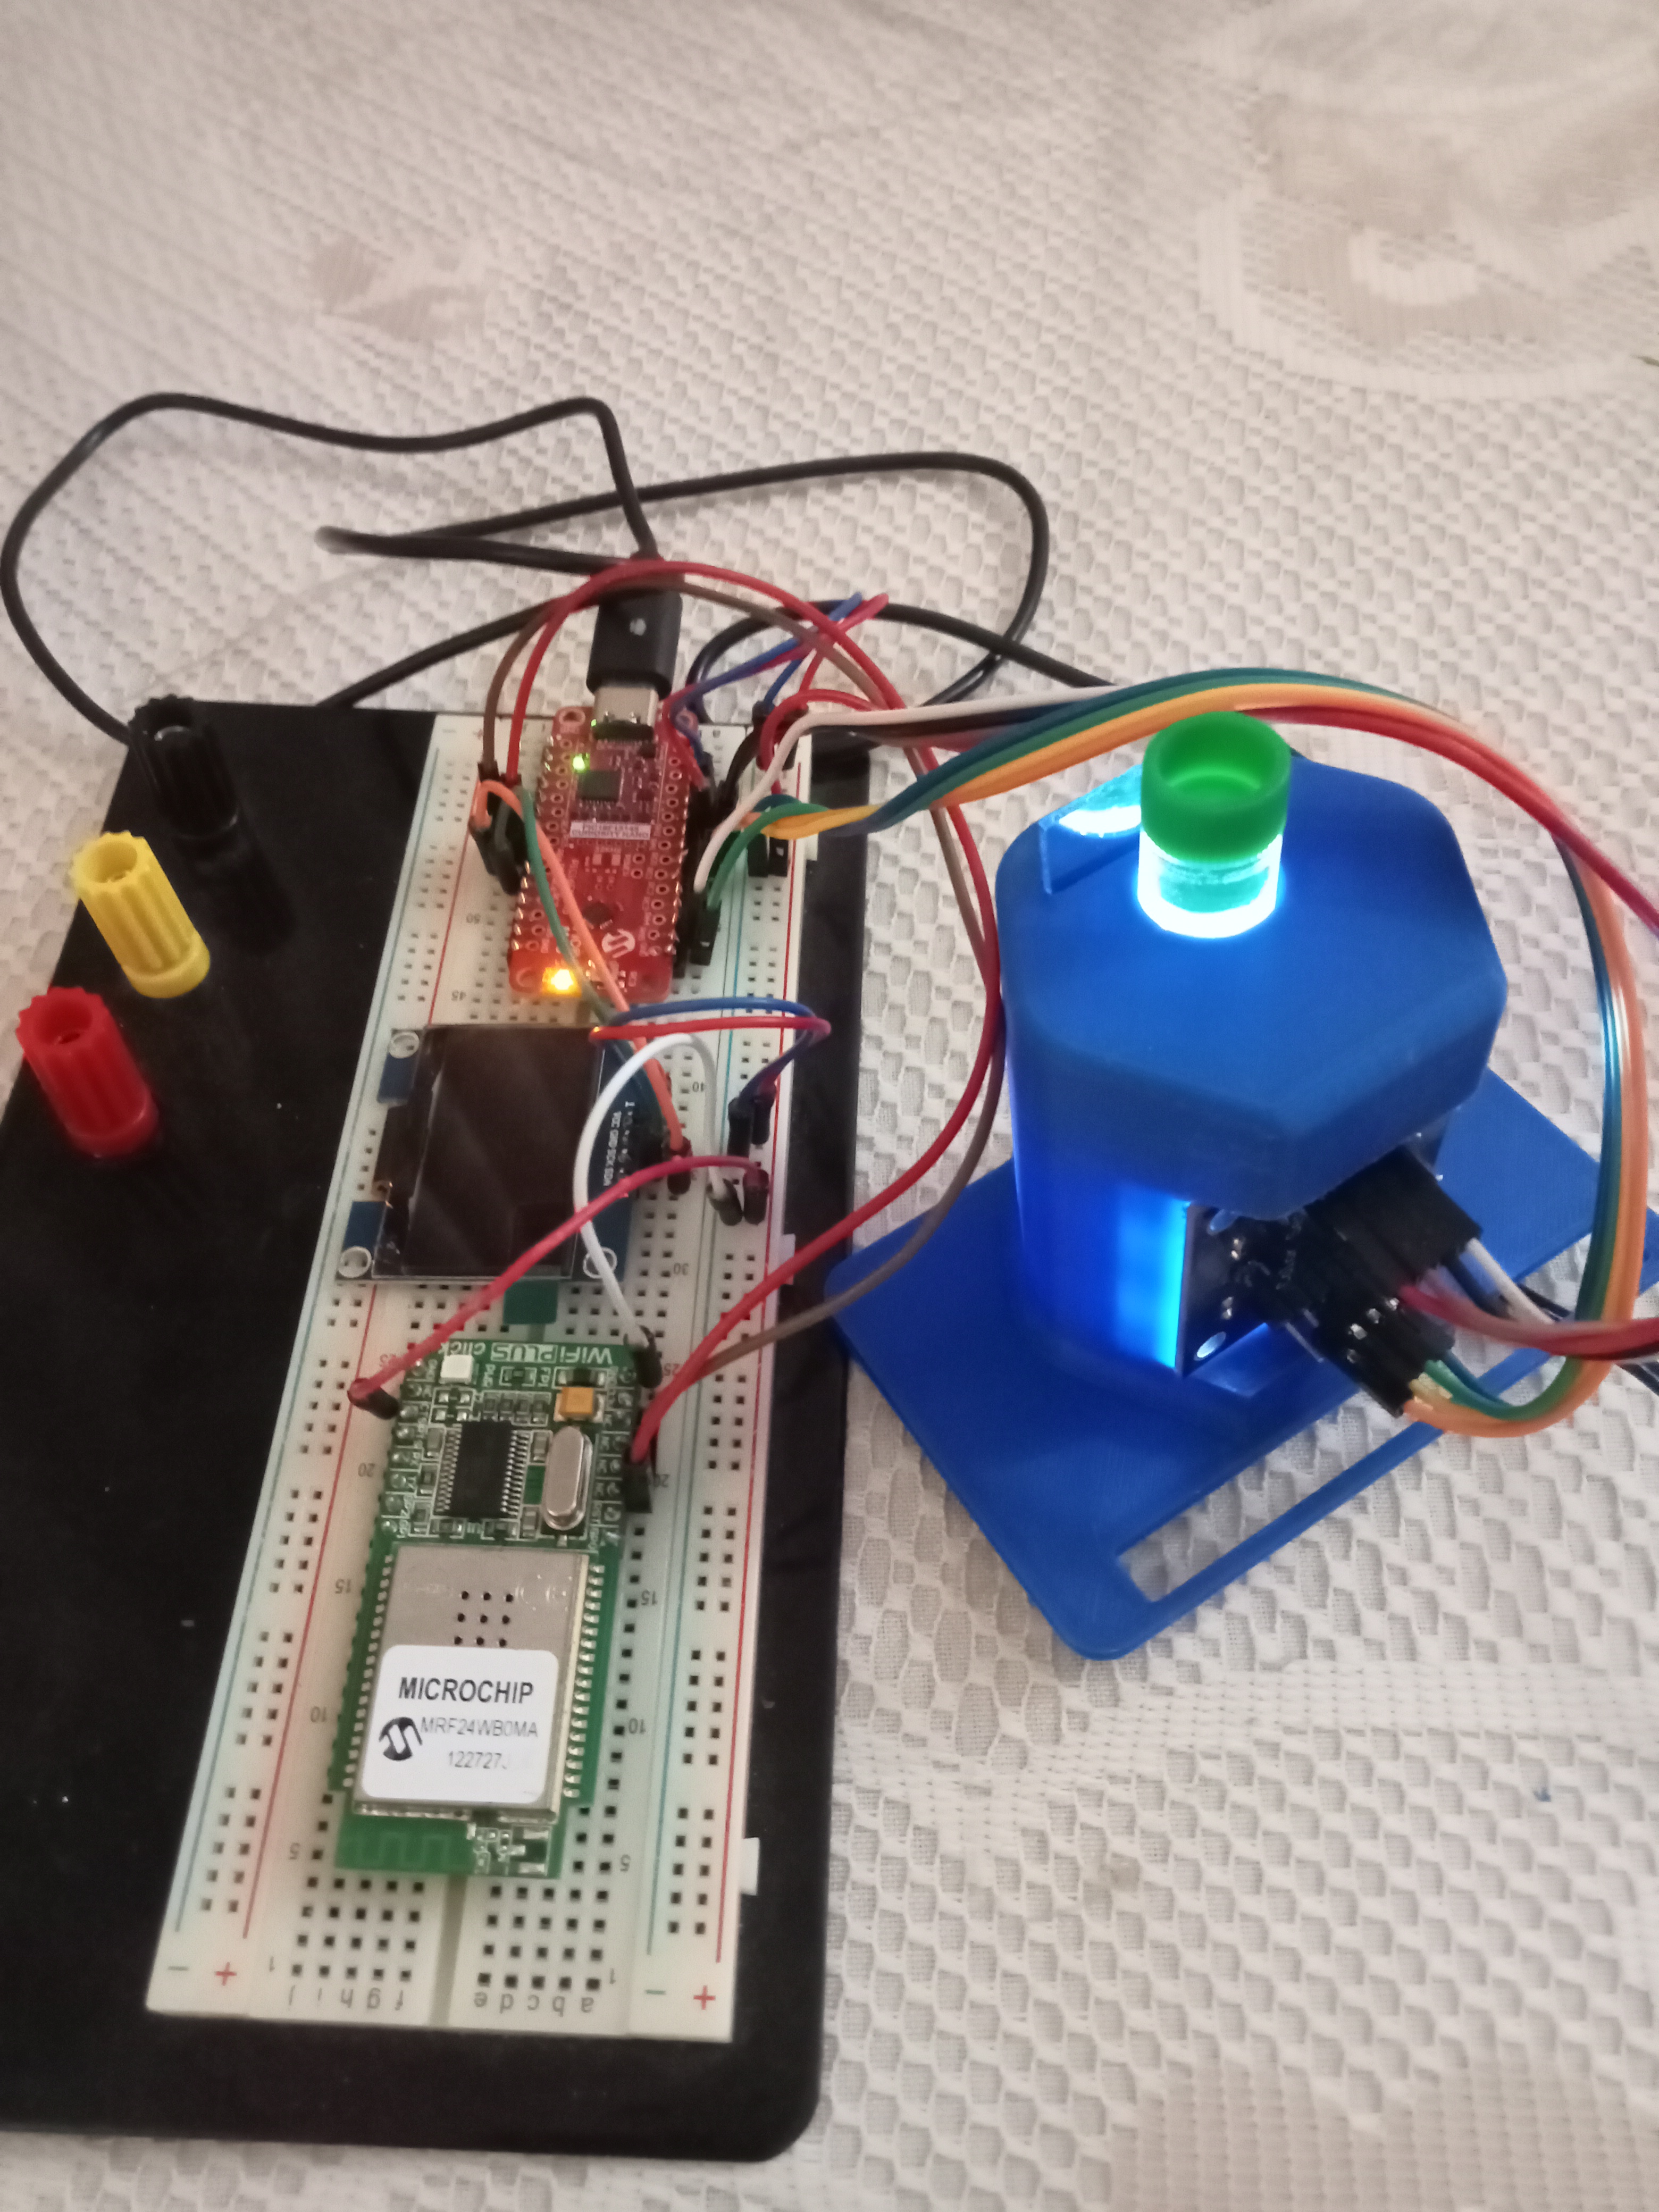
The proof of concept System