A Dynamometer is a device that measures torque and rotational speed of an engine, learn to build one with this tutorial!
For quite some time I’ve wanted to make a motor test stand to be able to measure the real-world power curve for motors — especially brushless motors. Hardly any hobby motors listed online provide this information, at best listing a stall torque, stall current, and no-load RPM.
For brushed motors, it is possible to generalize this information to an extent. However, with brushless motors, the ESC plays a huge roll in how quickly the motor can accelerate and decelerate and its overall efficiency.
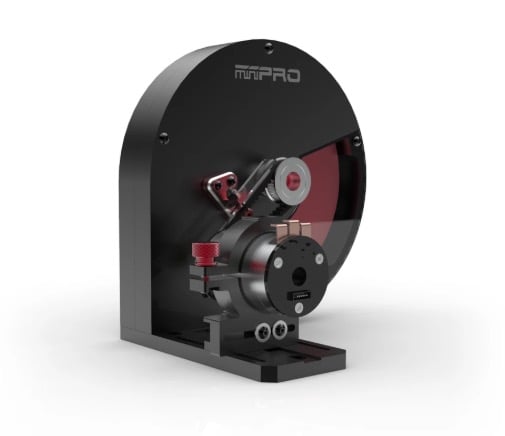
An electric motor dynamometer. Image credit: MiniPro.
I’m stepping out to create a custom, DIY motor dynamometer (dyno for short) that can use physics to plot out the exact power curve of the motor for a known load. Yes, these products do exist, but they are incredibly expensive! It will be a big undertaking with multiple parts. In this first article, I’ll cover my basic design principles and how physics comes into play.
The Physics Behind a Dynamometer
I will try to keep this to a minimum of incredibly boring math equations, but understanding the general principles of how and why this works is pretty interesting.
Anybody who has taken highschool physics will be familiar with the following simple calculus equations (with prime notation indicating d/dt and no=n(0):
F = m*α , where: F = Force, m = mass, α = linear acceleration, v = linear velocity, x = displacement
All of the above locations apply to any linear motion. Their rotational counterparts are exactly the same, just replace mass with rotational inertia I, displacement with angle θ, velocity with angular velocity ω, and acceleration with angular acceleration α, and force with torque τ.
Determining Torque
Our goal here is to determine torque. To do this, we measure the rotation speed and the time period over which that changes, with a known rotational inertia as the load on the motor. From there, we can easily determine the speed’s rate of change, which gives us angular acceleration, and from that (plus the known inertia) we get the torque!
Let’s say we are running the motor and sampling its speed every second. Every time we would use an integral or derivative we can instead look at the fixed unit change per unit time, which will be in seconds. So if the motor accelerates our load of, say, 5kg*m^2, from 2 rad/s to 4 rad/s in 1 second, we get the following:
So we arrive at the torque being 10 Nm!
Now imagine we are actually sampling this 10 times a second, while the motor spins at different rates accelerating and decelerating. We can throw all this data into an Excel spreadsheet and easily get a running tally of torque values.
By also measuring the changing voltage and current input, we can then determine electrical input power, mechanical output power, and the overall efficiency curve. Plus, we can calculate a more accurate kT constant for the motor than what the spec sheet gives us. Removing the load will allow for the calculation of kV as well as no-load RPM.
The only information this equation won’t tell us is the stall torque. However, in ordinary use cases, brushless motors are never stalled so this is of minor importance.
Parts Required to Build a Dyno
To measure and log the information quickly and precisely enough for it to be useful, we can use an Arduino as well as a host of sensors.
Note: the Raspberry Pi is not suitable for this application as it doesn’t run a real-time OS and cannot log the changes fast enough for the best sample rate.
Measuring current spikes accurately comes down to the frequency at which the measurements are taken. The faster the better, which means the cycle time must be as low as possible. Realistically, we can expect to receive measurements every handful of milliseconds, instead of every second like in the example.
The table below lists out all of the required hardware. The prices are what I paid in USD and serve to be an estimate of what you can expect to pay.
Item | Purpose | Price |
|---|
50A bidirectional current sensor | Measure motor/battery current draw | $ 16.50 |
Voltage Tester Sensor Measurement Detection Module DC 0-25V (10 pcs) | Measure battery voltage | $ 5.99 |
2pcs ADS1115 16 Bits 4 Channel ADC | 16 bit resolution on current and voltage measurements | $ 8.99 |
3X Arduino Nano boards | Run the code to control the entire project | $ 10.35 |
HC-020K Double Speed Measuring Module with Encoders 20CPR | Measure speed of motor | $ 9.99 |
2PCS MicroSD Read And Write For Arduino | Micro SD card reader for data logging | $ 2.75 |
Samsung 32GB 100MB/s (U3) MicroSDXC EVO | Store data logs | $ 6.49 |
HiLetgo 0.96" I2C IIC SPI Serial 128X64 OLED LCD Display | Display collected data in real time | $ 6.99 |
Sutemribor 380Pcs 20 Sizes, 4#-40 to 3/8"-16 Set Screws | Connect shaft to flywheel | $ 19.99 |
Bonbo 10Pcs R4-ZZ Bearings 1/4 x 5/8 x 10/51 inch, Ball Bearings | Minimize flywheel friction | $ 7.99 |
1/2" Steel Plate, Disc Shaped, 5" Diameter, .500 A36 Steel | Flywheel disk weight | $ 13.50 |
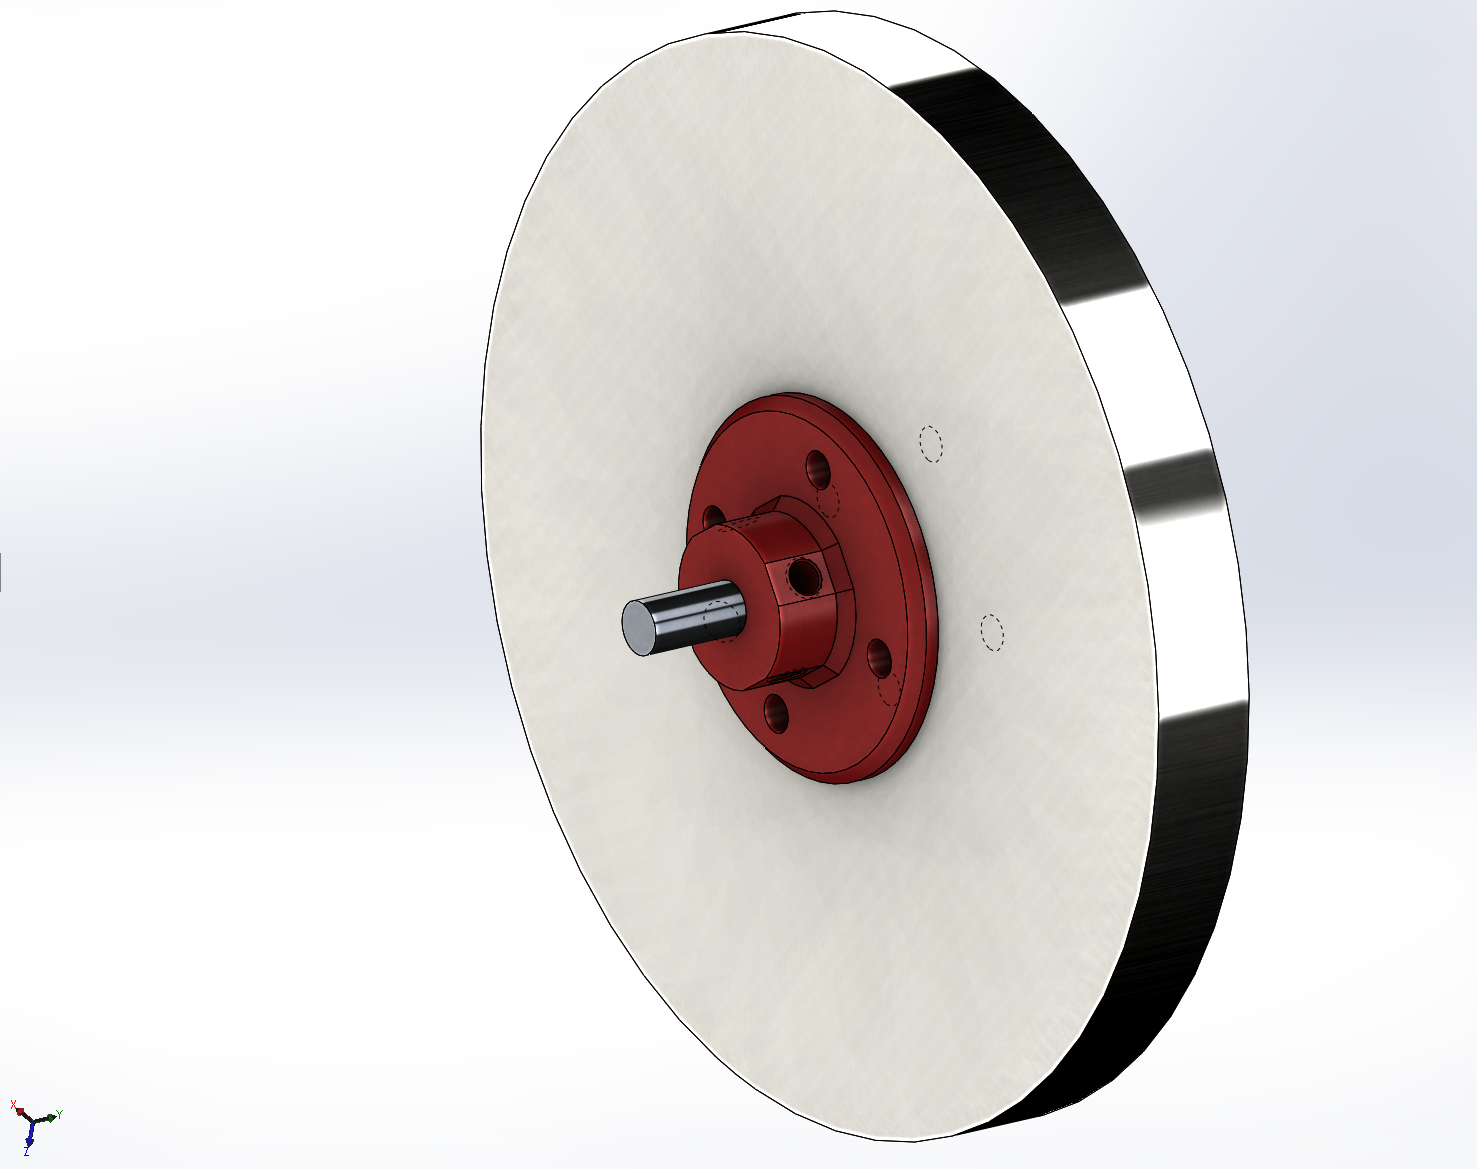
A Solidworks model of a flywheel with a 3D printed hub to fix it to a central axel.
Important Parts of a Dynamometer
To better understand the final product of this project, let’s go over the crucial parts of a dynamometer.
Bidirectional Current Sensor
A Bidirectional current sensor turns current measurements into a voltage between 0V and the reference voltage (for us 5V). It comes in unidirectional and bidirectional variants. For the bidirectional 50A variant, a reading of 0V indicates -50A, 2.5V indicates 0A and 5V indicates 50A, with any value in between scaling linearly (i.e. 4.25V = 35A).
Voltage Tester Module
Honestly, you could make a voltage tester module yourself for a few cents worth of resistors as it’s really just a voltage divider. This poses a problem since it only scales the input voltage from 0-25V to 0-5V, meaning you get 1/5th the resolution as if you directly used analog read on a voltage less than 5V. (This will be addressed by the next article.)
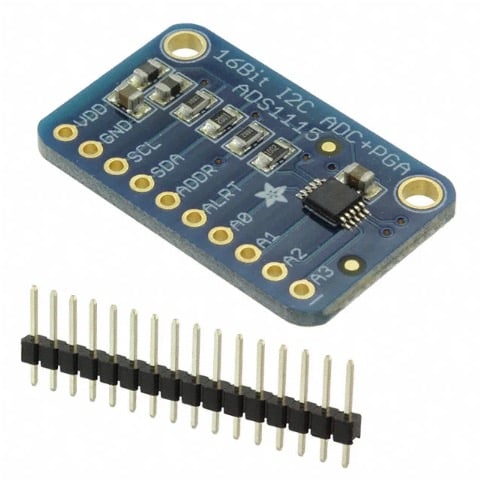
ADS1115 16-Bit 4-Channel ADC
This is a fantastic little board. Instead of being stuck with the 10-bit 1024-count resolution of the Arduino’s built-in analog to digital converter that the analogread command will give us, this provides four separate 16-bit ADC readings which then give readings of up to 65,536 counts.
ADS1115 16-Bit 4-Channel ADC. Image credit: Digi-Key
This is especially great for the 50A current module as its effective resolution will be only half of what it might be for a unidirectional sensor, since between 2.5V and 5V are the whole 0-50A range. With only 512 counts that’s only 0.244 amp resolution, which is huge when we’re also measuring small motors at currents under 1 amp.
Imagine if you could only read 0, 0.24, 0.48, 0.72, or 0.96. The value will jump around between whichever of those is closest to the actual infinitely variable reading. With 16 bits instead of 10, this gives us a theoretical 0.0038 amp resolution! This is far better for accurate calculations measuring motors drawing only 1 amp or so, without limiting our measurements to just that range.
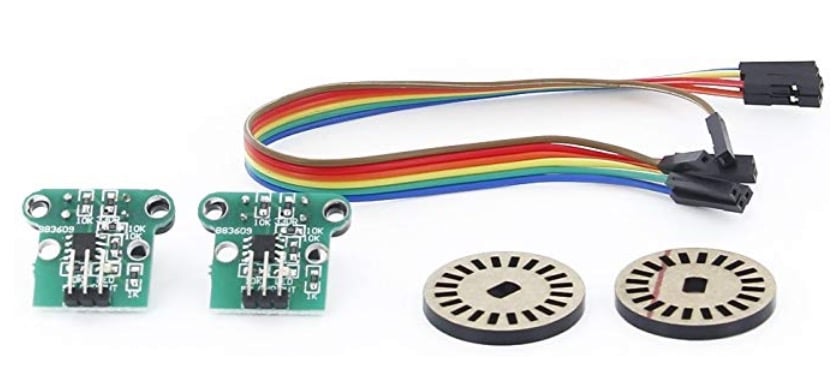
HC-020K Encoder 20CPR
The HC-020K encoder 20CPR 20-count per rev encoder is plenty for what I need. A single count per rev would likely have been suitable, but this will better help with calculating low speed acceleration. It was also important not to have too many counts per rev as with 20, at 30,000 RPM that means 600,000 counts per minute or 10,000 per second!
An HC-020K encoder 20CPR 20-count per rev encoder. Image credit: Amazon.
Making sure the Arduino can capture every count is super important. Thankfully, by simply taping over gaps in the included 20-gap disk or 3D printing/laser cutting ones with just a couple gaps, the CPR can be customized to give a lower number of counts-per-second at higher speeds. I can verify if there are counts missing with an external laser tachometer (~$20).
MicroSD Card and Readers
Having a MicroSD card and reader allows the data to export as a .CSV file. Any PC can read a .CSV file with Excel to do the math and display a final graph and torque curve. Since the Arduino itself will essentially forget everything and start over each time the program runs, we can set it to randomly generate unique filenames to avoid overwriting the same file each time.
Possible Sources of Error
Anytime you build a tool from scratch — especially ones meant for measurement — there are areas that could possibly provide an error. Let’s take a look at what those areas could be and how it’s possible to minimize or avoid them.
Inaccurate Rotational Inertia Ivalue
It would be a fool’s errand to try and calculate a perfectly exact rotational inertia of the setup.
Friction from the bearing s is variable and difficult to account for, and the exact rotational inertia of the motor’s rotor itself and bearing races will contribute to the total.
Minimizing this error is as simple as ensuring the flywheel mass and I value dwarfs that of the motor such that it contributes an insignificant percent of the total inertia. Even so, this measurement will never be perfectly accurate.
Getting as accurate a measurement as possible for the flywheel and shaft dimensions, and verifying their ideal I values in CAD will go a long way to eliminating inaccuracy here.
Sensor Calibration and Drift
Sensor calibration and drift are nearly impossible to fully account for. Even changes in temperature and humidity affecting the conductivity of the various elements will cause sensor drift, especially when we’re talking about 5/65536 volt increments.
Further, chances are that we will not see exactly 2.5000 volts from the current sensor when no current is applied, so this needs to be calibrated out as best as we can to minimize errors here.
Solidworks calculating the rotational inertia about the central axis of the flywheel model shown.
Mechanical Losses to Friction and Air Resistance
The effects of plain old friction should be apparent, but air also plays a role.
All the calculations above assume that this thing is rotating in a vacuum and has 0 friction. In reality, even with a disk with no blunt edges rotating, the air’s viscosity will create vortices when in contact with the spinning disk. This is how a baseball pitch can curve, after all.
Air resistance increases with the square of the rotational speed of the disk and cannot really be accounted for in any practical manner. The slower the thing spins, the less of an effect this resistance has, so using a relatively small diameter, thicker disk to raise I will help. Driving the flywheel from a belt inherently creates some more efficiency losses, as a belt drive is up to 98% efficient.
Electrical Noise
Motors are inherently incredibly noisy. On one side, we have sensors running on DC voltage, while a brushless motor is powered by 3-phase AC. Running the whole system off of a battery instead of AC can help reduce noise, and running the Arduino and ESC/motor off of separate batteries could help further. Beyond that, electrical shielding should be used as needed.
Obviously, this will have a number of limitations beyond just those outlined above, but it should certainly provide me with plenty of scientifically valid comparison data for motors all tested with my own device. Using different I flywheels can help better characterize the behavior for a single motor, and I’m interested to see how ESC settings play a role especially with startup power limits.
Next Steps
So far I’ve laid out my general idea for the motor dyno and proven how it will work to provide useful torque curve data with the physics behind its functionality. I’ve also gone over many of the pitfalls I will inevitably run into when trying to use these ideal condition equations in the real world.
Hopefully, I can generate data fast enough for good temporal resolution, and with some effort, minimize the error contribution from many of the above causes to get reliable, accurate data. I am very confident that I’ll get data which is great for comparing motors tested with my own dyno against each other and draw meaningful conclusions.
Whether it will be reliable and accurate enough to support or refute the claims on a spec page… who knows until I build it!
This project will be ongoing for the next several weeks. Part 2 of this project covers the mechanical assembly for the dyno, Part 3 details how I wire up all the electronics, and Part 4 focuses on the Arduino code, the Excel sheet for converting the raw data into motor curves, and the big reveal of my results.