Maker Pro
NXP FRDM

Smart Home Monitoring system

PD
October 08, 2025 by PIETRO DE NICOLAIS
Share
banner

This project created an intelligent indoor climate control system on an embedded NXP i.MX93 board. It uses a BME680 sensor and ML inference with a TensorFlow Lite model to automatically manage air quality. A real-time Flask dashboard displays sensor data, AI decisions, and weather information for optimal environmental control.

The flowchart illustrates the complete workflow of the embedded AI system for indoor air quality monitoring and control implemented on the FRDM-i.MX93 platform. It describes how sensor data flows through the system, how decisions are made, and how results are displayed in real time. Start The process begins when the embedded system is powered on. Initialization scripts load the sensor driver, baseline files, and the trained AI model for inference. Read Data from BME680 Sensor The system continuously reads temperature, humidity, pressure, and gas resistance values from the Bosch BME680 sensor over the I²C bus using the custom Python driver bme680_smbus.py. Calibration parameters are applied to ensure accurate measurements. Compute Adaptive AQI Using the collected environmental data, the system calculates an adaptive Air Quality Index (AQI). This is derived from a weighted formula: 60% gas 20% humidity 20% temperature The algorithm maintains a dynamic gas baseline, stored locally to adapt to environmental changes over time. Integrate External Weather Data In parallel, the system queries WeatherAPI.com to fetch real-time outdoor conditions for Avellino (temperature, humidity, weather status). The difference between indoor and outdoor values is computed and saved in climate_data.csv. Make Automated Decisions (AI Model) The pre-trained PyTorch model, converted and quantized to TensorFlow Lite, runs locally on the board using tflite-runtime. It predicts optimal control actions for: Window (Open/Close) VMC (Off/Low/High) Air Conditioner (Cool/Off/Heat) These decisions are based on both indoor and outdoor environmental inputs. Display on Web Dashboard All data and decisions are visualized on a Flask-based web dashboard. The interface displays live readings, AQI with color-coded graphics, AI recommendations, and 3-day weather forecasts. The page refreshes automatically every 30 seconds and support English. End / Loop After displaying results, the process repeats every 60 seconds, ensuring continuous monitoring and adaptive control.

The photo shows the embedded AI air quality monitoring system running on the FRDM-i.MX93 development board. The system is connected via SSH for debugging and real-time logging of sensor data and AI decisions. On the screen, the console output displays the live readings from the BME680 environmental sensor (temperature, humidity, pressure, and gas resistance), along with the computed Adaptive Air Quality Index (AQI) and the AI-driven control actions for the window, ventilation unit (VMC), and air conditioner. All this information can also be visualized through a modern web dashboard, which is accessible in two ways: via HDMI output, directly connected to a local display, or by accessing the embedded web server from any device on the same local network. The dashboard presents real-time data updates, 3-day weather forecasts, and AI decisions using an intuitive and animated interface. This photo highlights the integration of the software debugging environment with the graphical user dashboard, demonstrating the system’s full monitoring and control capabilities.

The image shows the neural network architecture of the embedded AI model used for intelligent air quality control, visualized through NXP’s eIQ Toolkit. The displayed structure corresponds to the exported and optimized TensorFlow Lite model (saved_model_converted.tflite) running on the FRDM-i.MX93 development board. The model, originally trained in PyTorch 2.0+, processes eight environmental input features, including indoor temperature, humidity, gas resistance, external weather data, and temperature/humidity deltas. It consists of two fully connected hidden layers of 32 neurons each, activated by ReLU functions and followed by dropout regularization (30%). At the output, the network splits into three independent branches (multi-head architecture): Window Action (2 classes): open or close VMC Action (3 classes): off, low, or high ventilation AC Action (3 classes): cool, off, or heat The training was performed on a dataset of 3,744 records (13 days × 288 samples/day) using Adam optimizer and CrossEntropyLoss for 200 epochs. The model was then exported to ONNX (opset 15) and converted for edge deployment using openvino2tensorflow within Docker. It was further optimized and quantized (Per-Tensor) using NXP’s eIQ Model Tool, achieving a final size of approximately 100 KB and a latency of <10 ms per inference on the i.MX93 NPU. The diagram in the photo highlights the internal structure of the TensorFlow Lite graph, showing the sequence of fully connected layers and activation functions leading to the three output branches. This optimized model enables the embedded system to perform real-time decision-making for ventilation, window, and climate control based on continuous sensor input — all running efficiently on the edge device without needing a full TensorFlow installation.

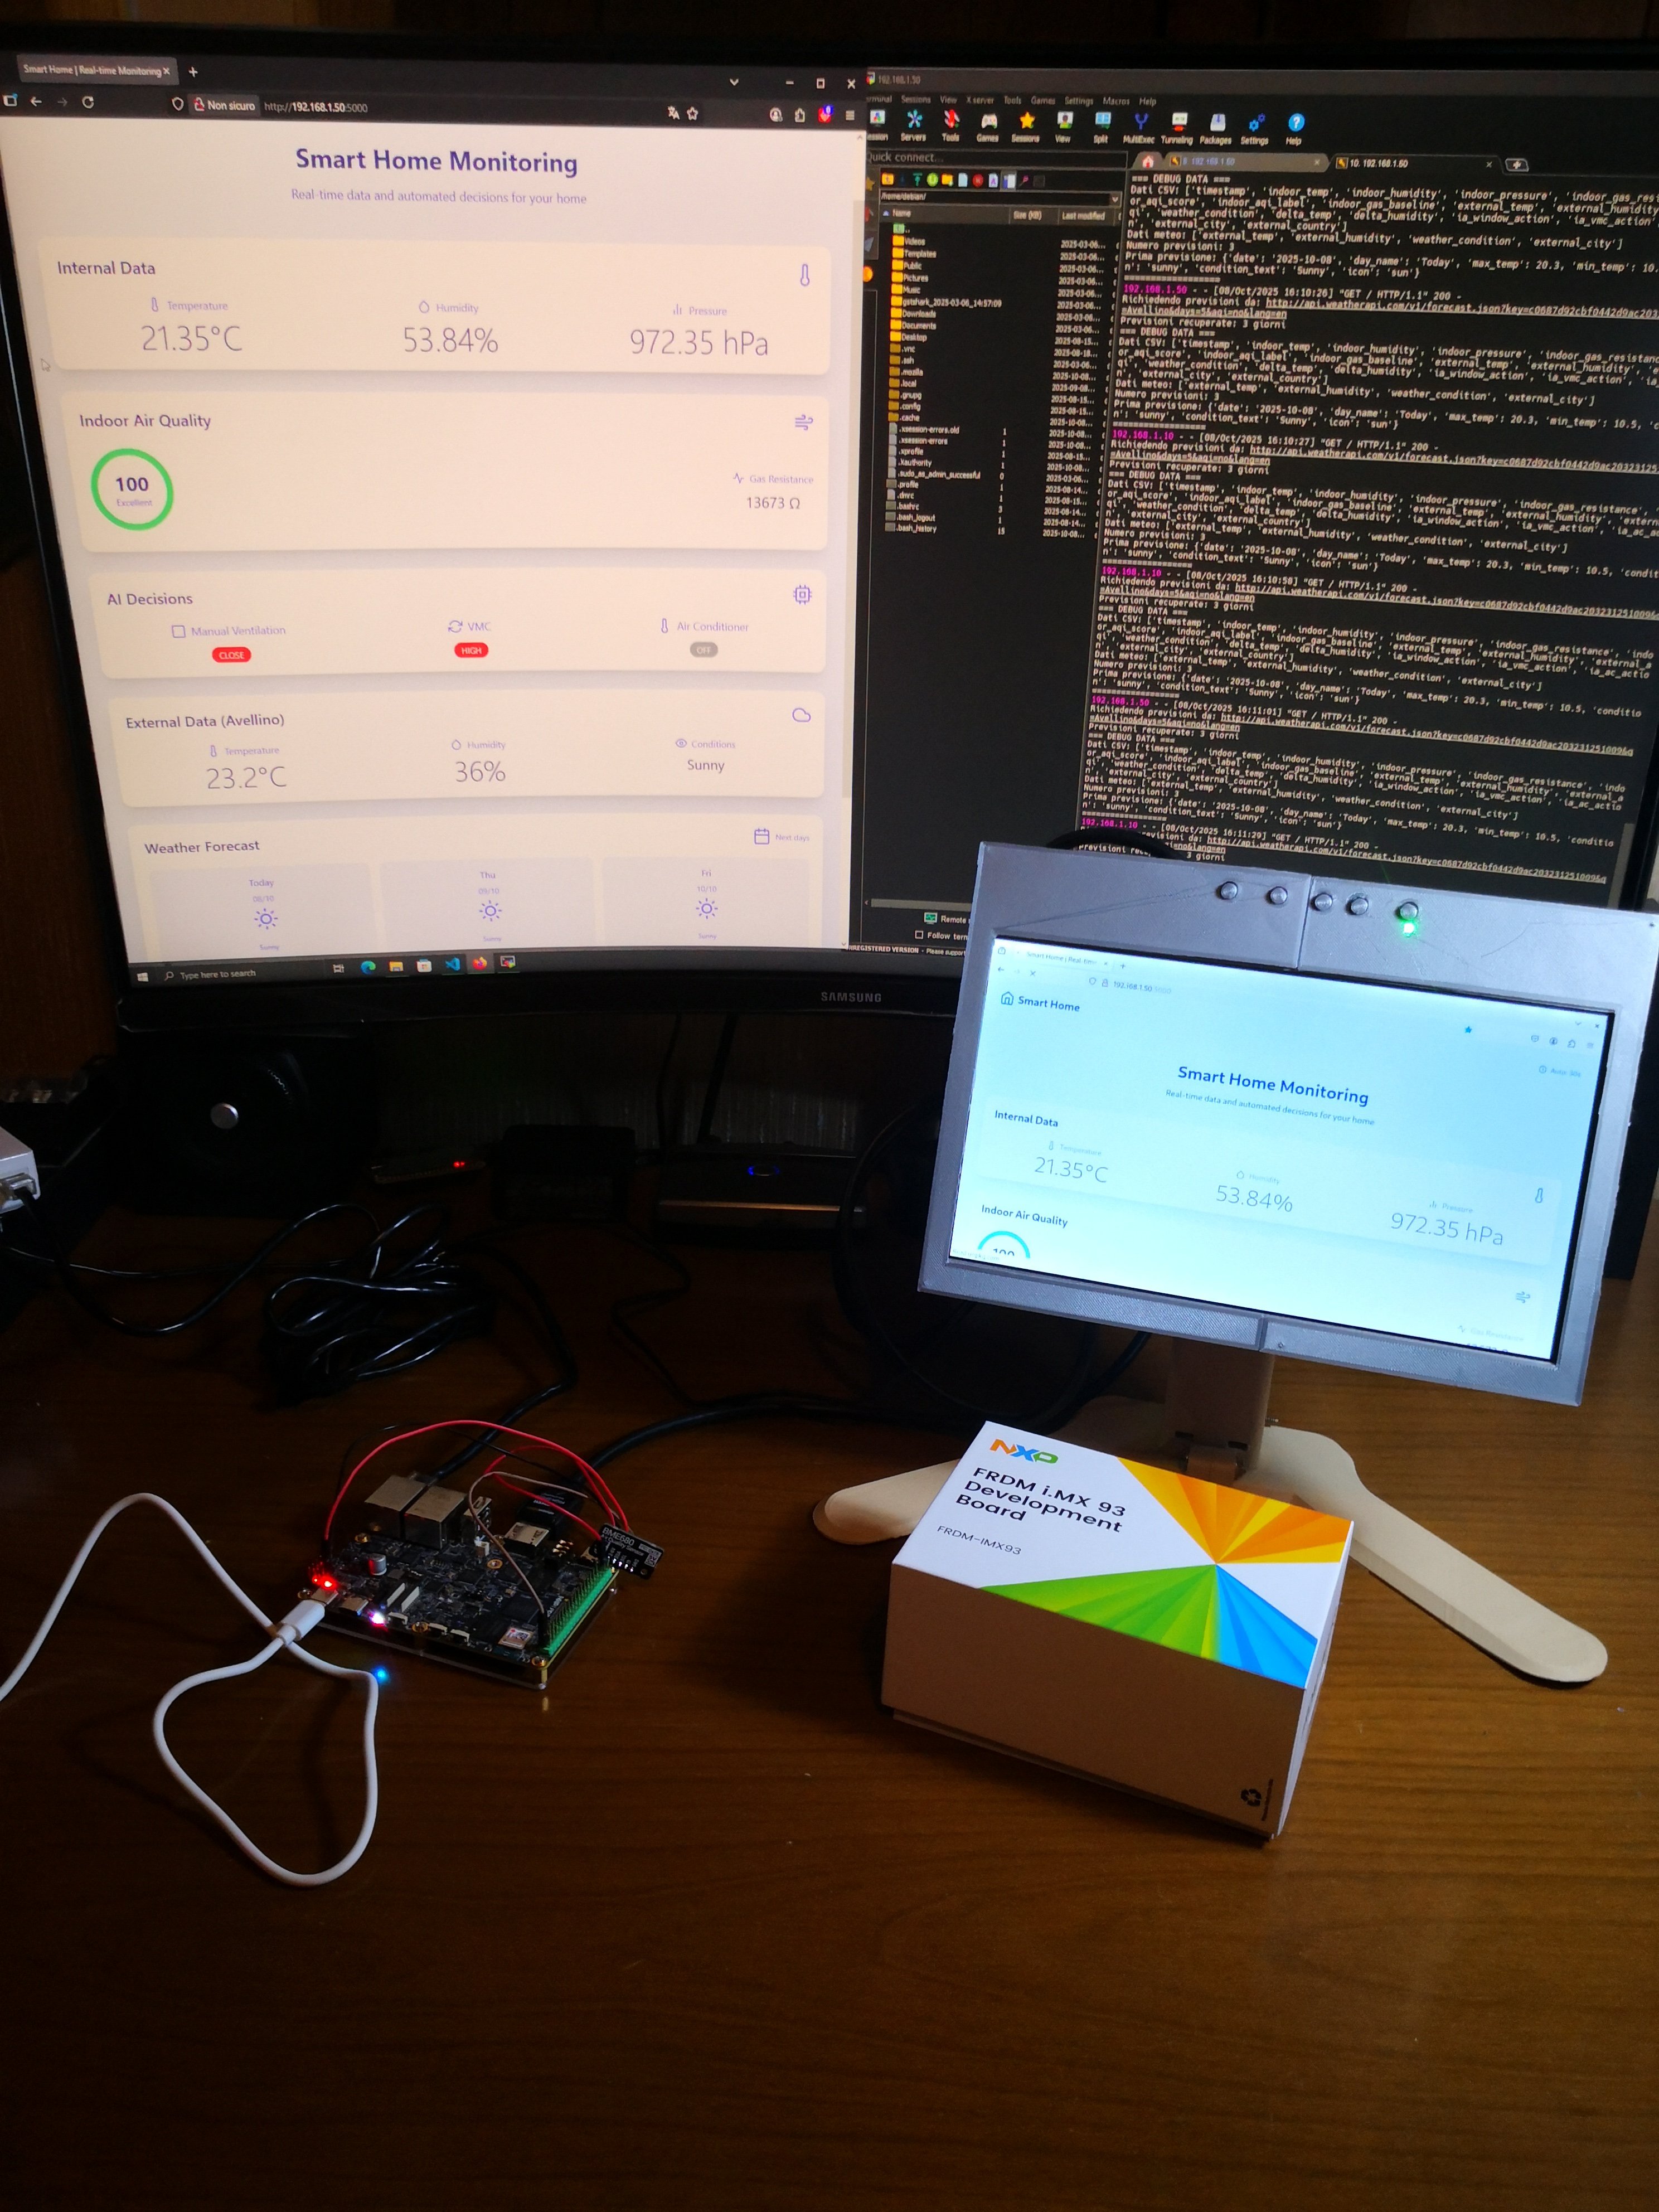
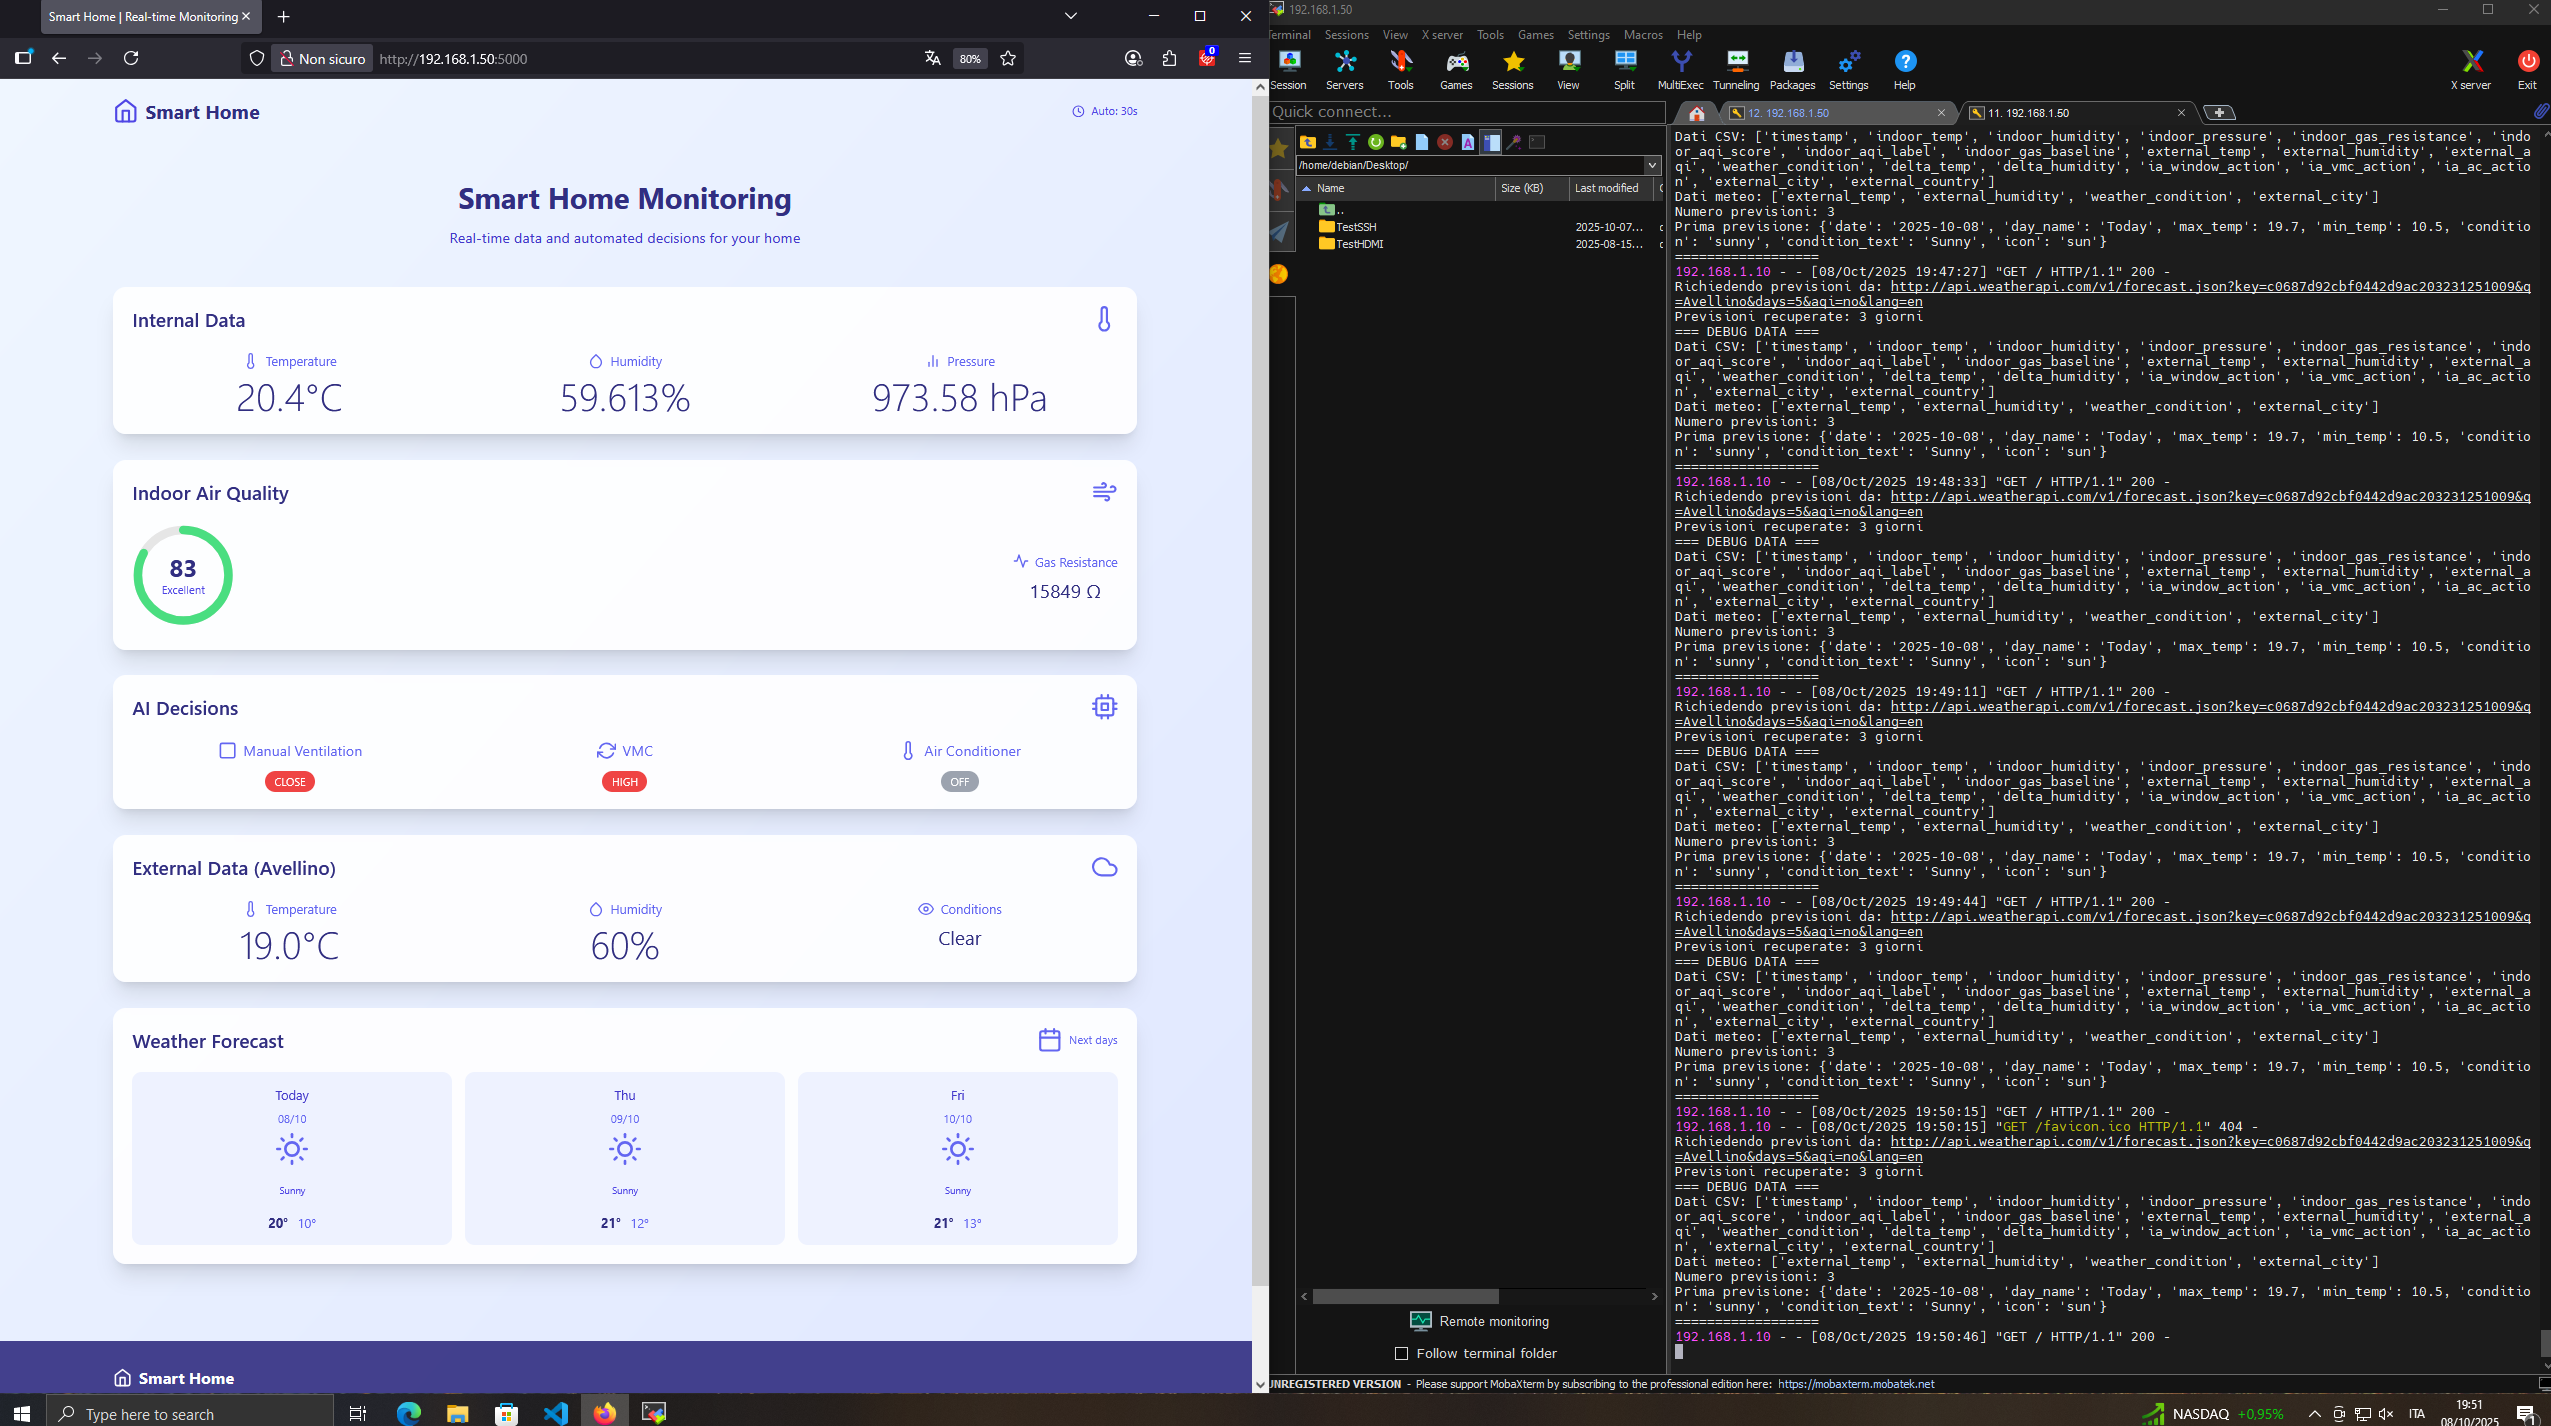
The image illustrates the web dashboard interface and the corresponding system monitoring output of the embedded AI project running on the FRDM-i.MX93 platform. On the left side, the browser displays the Flask-based Smart Home Monitoring Dashboard, hosted locally at http://192.168.1.50:5000. The dashboard provides a real-time overview of environmental data, AI decisions, and weather information through a clean, responsive interface. The backend, developed with Flask 3.1.2, reads the most recent environmental record from climate_data.csv, queries WeatherAPI.com for a 3-day forecast, and dynamically renders the web page using Jinja2 templates. The frontend is built with Tailwind CSS, Feather Icons, AOS animations, and Vanta.js for an interactive cloud-style background. Key components include: 
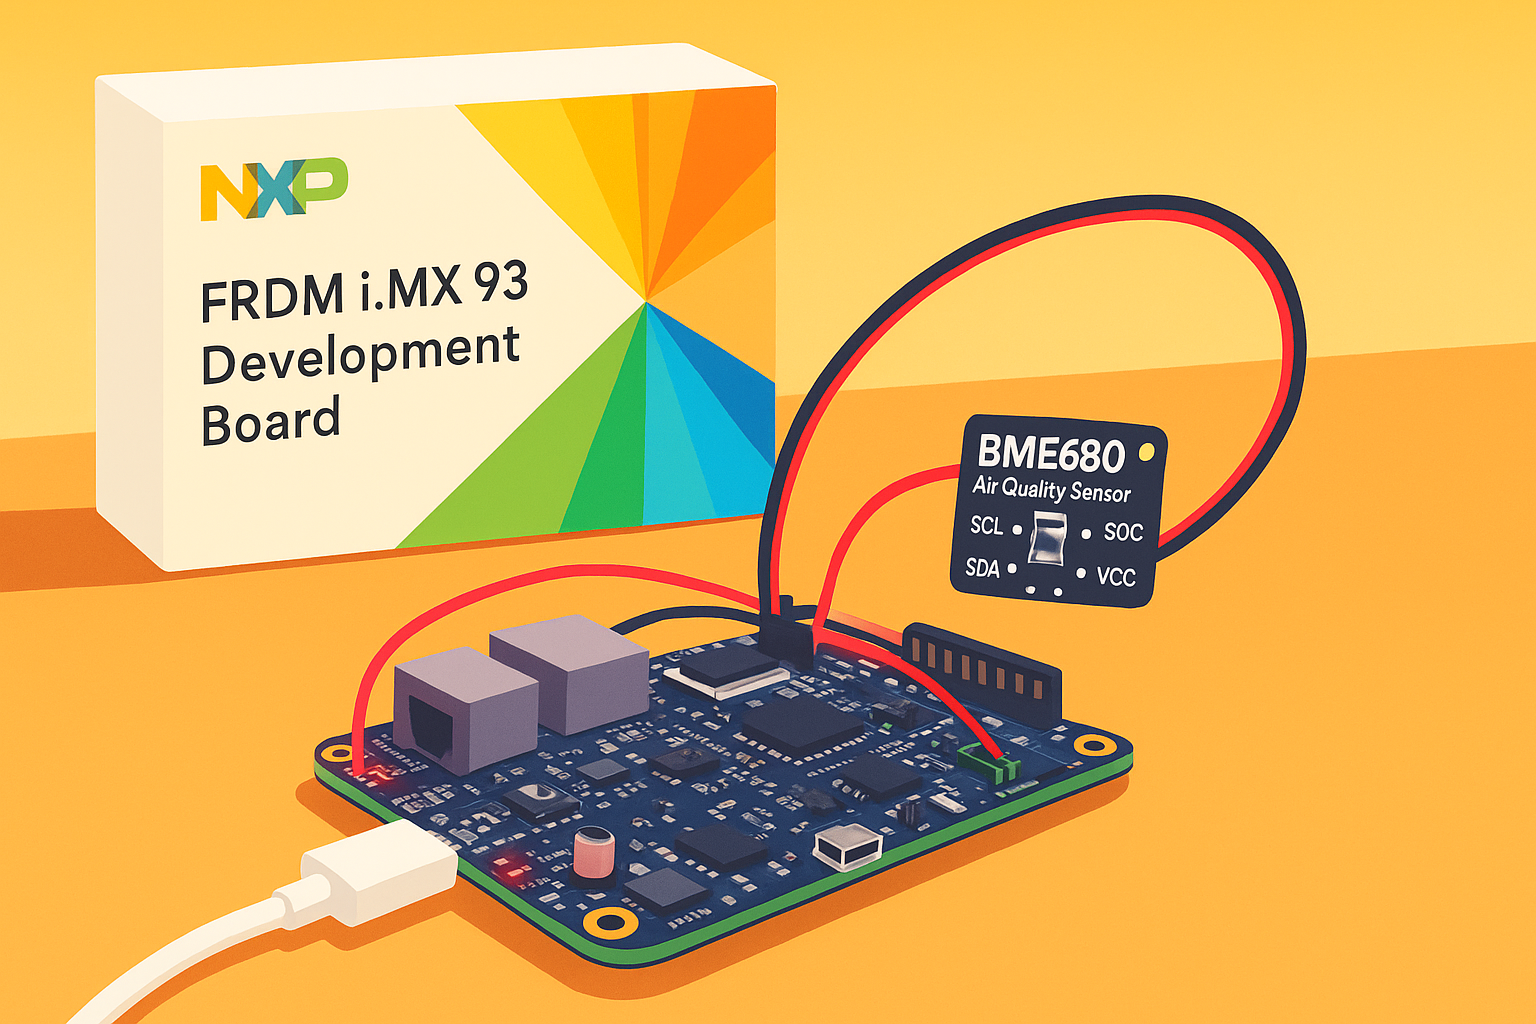
Internal Data Cards displaying temperature, humidity, pressure, and gas resistance from the BME680 sensor. Indoor Air Quality (AQI) gauge, color-coded and dynamically updated. AI Decision badges showing real-time automated actions (Window = Close, VMC = High, AC = Off). External Weather Data for Avellino and 3-day forecast cards with contextual icons. 
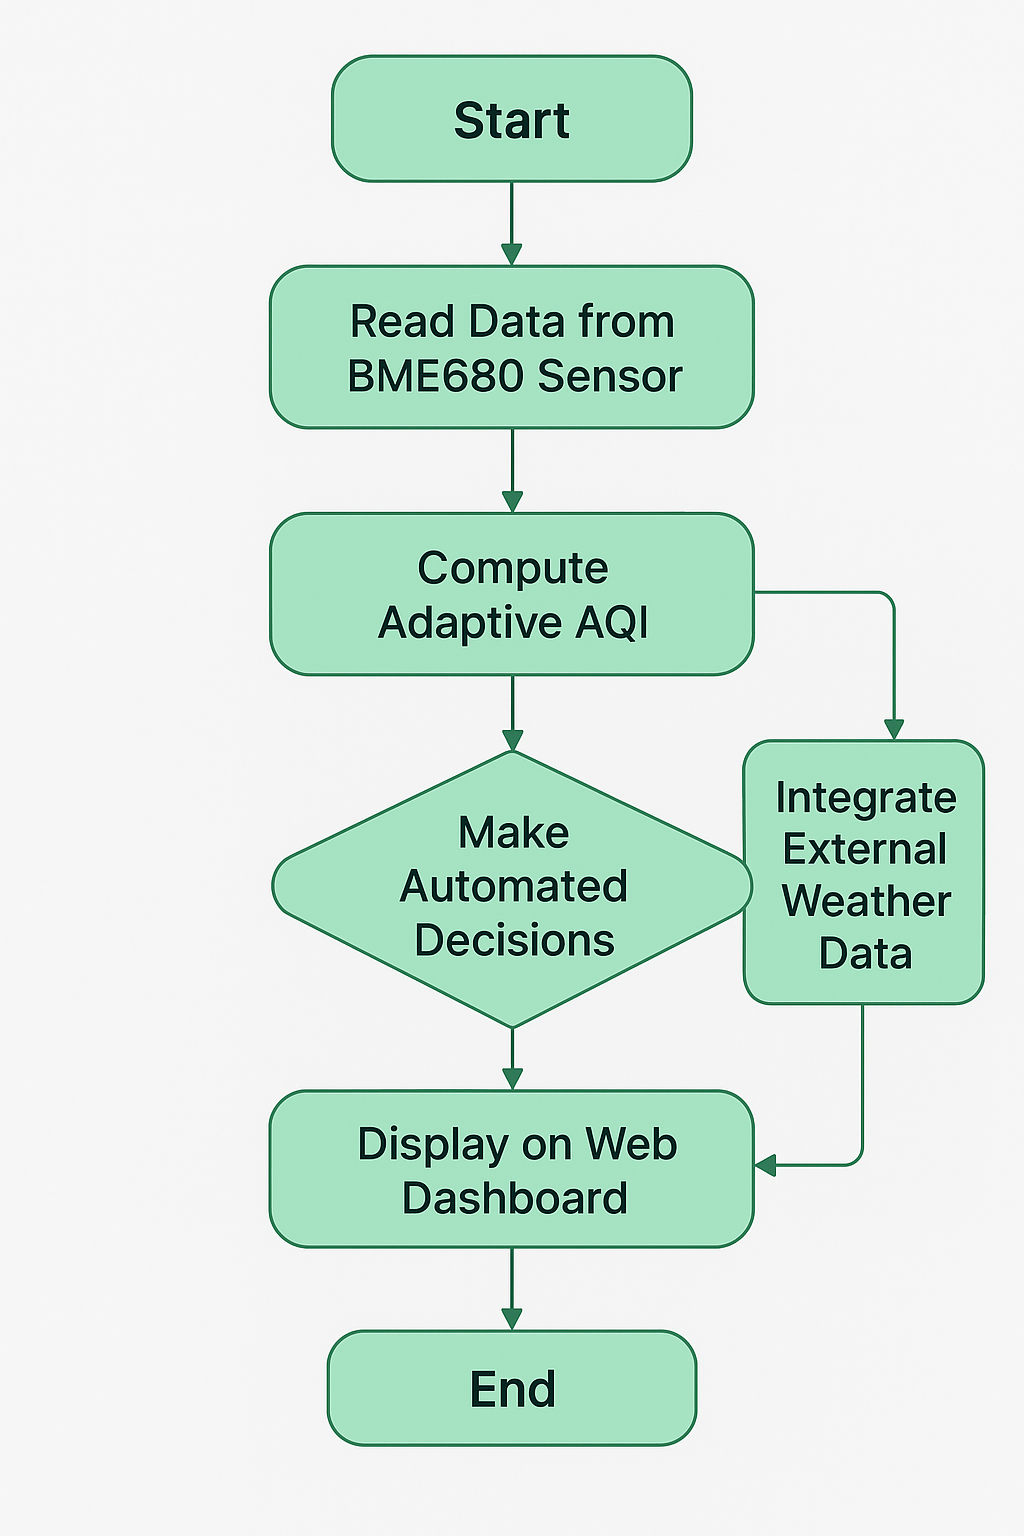
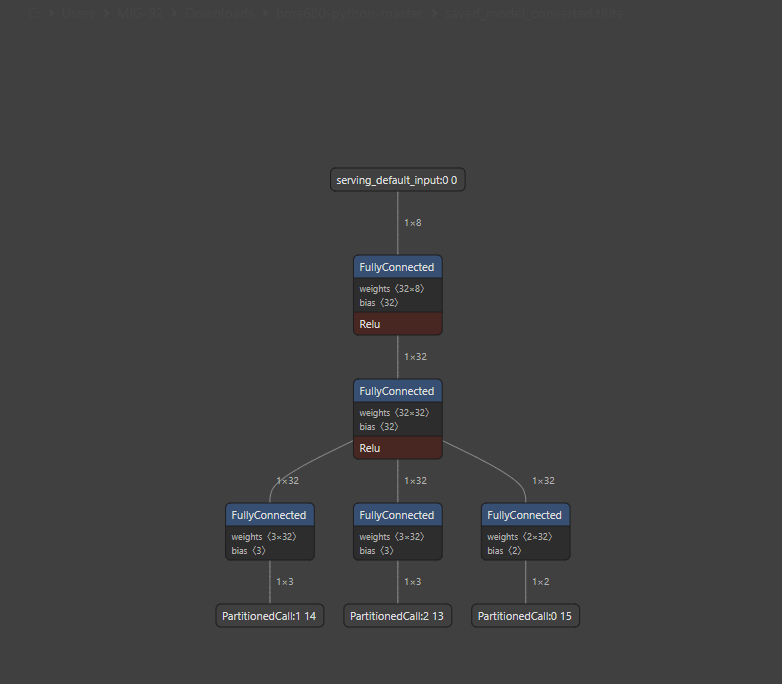
On the right side, an SSH session shows the real-time terminal output from the monitoring process (read_meteo2.py), which runs continuously on the board. This process reads BME680 sensor data every 60 seconds, performs TFLite inference using the quantized saved_model_converted.tflite model, and saves results to climate_data.csv. Meanwhile, the server (app.py) handles web requests and updates the dashboard accordingly. All data remains local to the device, ensuring privacy and energy efficiency, with no external cloud dependencies. This integrated setup demonstrates the system’s full capability — from edge inference and data acquisition to real-time visualization and user interaction, all operating autonomously within the local network.

Related Content

Categories

Comments


You May Also Like