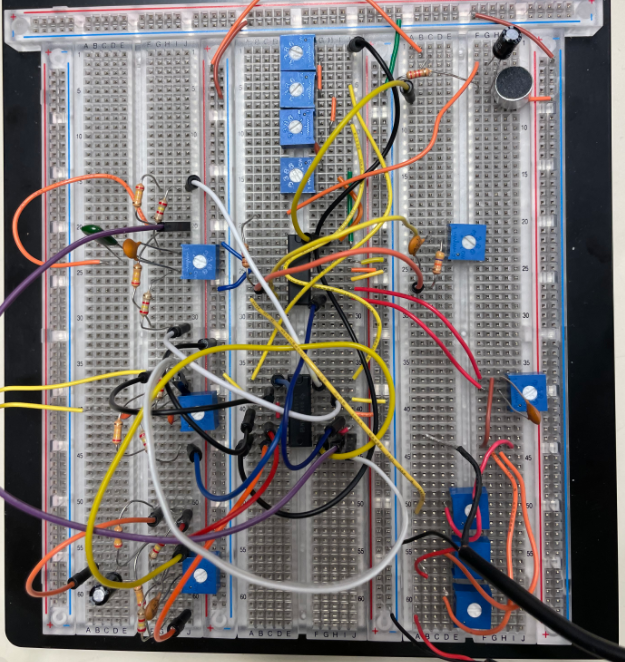
Audio mixer built on breadboard using through hole components, measured using Electrical Engineering lab equipment
Fully built Audio Mixer- Includes two audio inputs and one microphone input
This project is about amplifiers built with op-amps and how to represent their responses with mathematical equations and bode plots. We analyzed the response of simple, band-pass and band-stop filters by simulating the circuits in SPICE and also creating and measuring their outputs on our breadboard. We also combined the circuits we built from previous projects to create an audio mixer.
Introduction
The objective of this project is to use our preexisting understanding of filters, and design them to meet certain specifications. We then used the measured values to graph Bode plots and analyze the values further. Before conducting the experiment we simulated the circuits using SPICE and compared the results to calculated values. We analyzed the results of a simple, band-pass and band-stop filters using standard EE lab equipment such as the oscilloscope, function generator and DC power supply.
After simulating the results in SPICE, we built the circuits using breadboards and through-hole components. Ideal op-amps behave by having infinite voltage gain, infinitely high impedance (no current will flow through it), zero output impedance and the same voltage values at both the positive and negative terminals. Op amps are used commonly to increase circuit stability, increased input impedance and increased frequency bandwidth at constant gain. Capacitors and resistors were also used in these circuits. Resistors were used to drop voltage across the wiring and the capacitors were used to provide a temporary source of voltage for the circuit. Also, capacitors reject low frequencies while allowing high frequencies to be passed through, which makes them perfect for filtering circuits. We continue to use the RC approach to the making of the active filters as inductors are much more expensive and are more variable in their results.
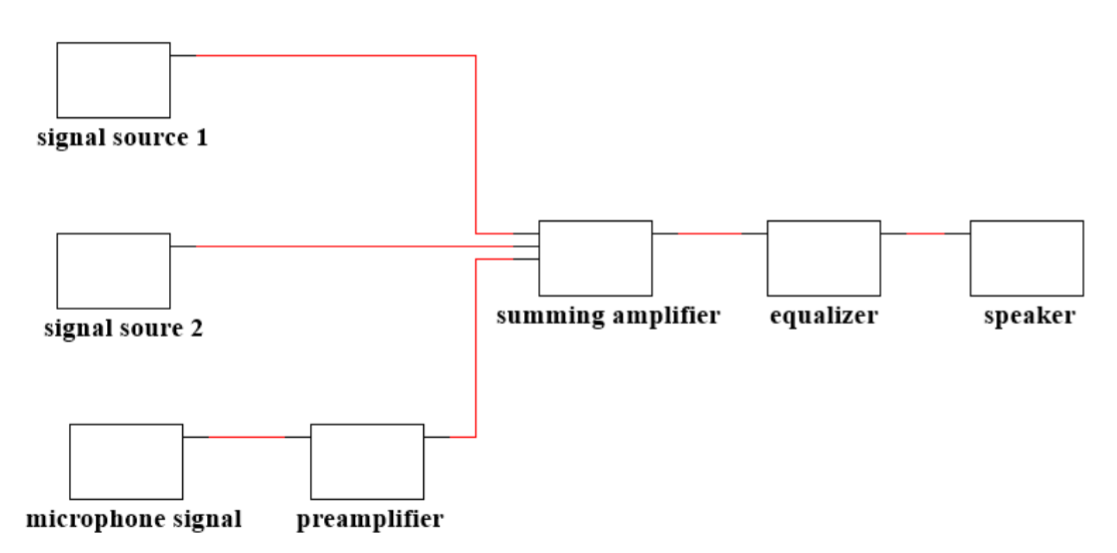
Using what we have learned and built from previous projects, we were able to build an audio mixer that included multiple signal sources, a pre amplifier, summing amplifier, equalizer and a speaker for our output. All in all, this project allowed us to see the practical applications of filters and put what we learned into practice.
Materials
For our work, the main tool that we used was Multisim. We used the AC analysis function to test our simulated circuit’s response to a range of sinusoids with frequencies from 10 Hz to 50 kHz. We used the provided MATLAB code to calculate the center frequency of our circuit given the values of each resistor. We also used excel throughout the lab to plot our measured data points. To measure these data points during the lab, we used a Tektronix oscilloscope. We used a probe with 1x attenuation with our oscilloscope to plot the signals in the time domain. We also used the spectrum analyzer to plot our signals in the frequency domain. In both cases, we used the Tektronix function generator to provide the signals we needed. Any DC power that was required to power our circuits was provided by the DC power supply.
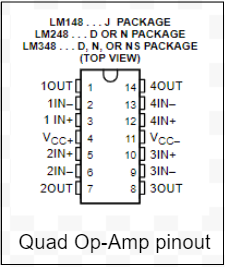
The main component that we used for this lab was the LM748N quad Op-Amp chip. We connected pins 4 and 11 to the DC power supply, setting them to 12V and -12V respectively. We connected the ground wires from the DC power supply to each other and to our circuit’s ground. The chip we used had outputs on pins 1, 7, 8, and 14, inverting inputs on pins 2, 6, 9, 13, and noninverting inputs on pins 3, 5, 10, and 12. This chip served the purpose of an active filter in a circuit when combined with resistors and capacitors. We used 50 kΩ and 100 kΩ potentiometers to control our circuits. The 50 kΩ potentiometers were marked with a “503” for 50 * 10^3 Ω and the 100 kΩ were marked with a similar “104”. We determined our resistor values using the universal resistor band color code and we matched the capacitor values printed on each capacitor to the capacitance values printed on the lab kit parts list. The final component we used was the microphone. The microphone unit had one of its leads tied to ground and the microphone case, so we checked the polarity of the unit when wiring it up. To hold the components we used for this lab, we used a solderless breadboard. We tied all of the grounds together and used two of the positive rails for the 12V and -12V Op-Amp power supplies.
Experimental Procedure and Analysis
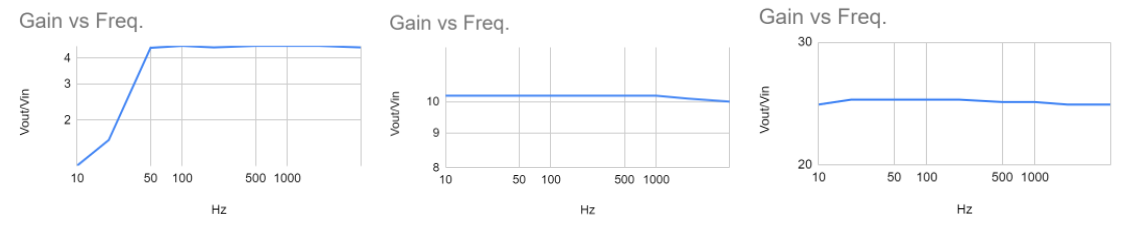
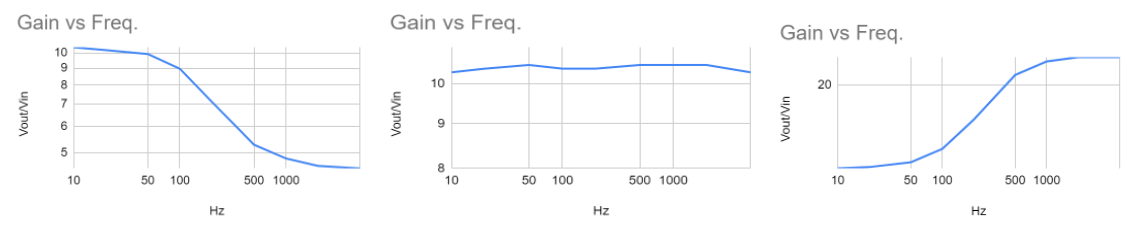
For the first part of the lab, we built a band pass and band reject filter and measured the gain for each circuit. The circuit design was the same for both, which means that the same filter can be changed between band-pass and band-stop by only tuning the potentiometer. We used values R1=R2=240 kΩ, R3=R4=2.4 kΩ and R5=100 kΩ, and for capacitance C1= 560 pF and C2= 1 µF (at 250 Hz) we changed the potentiometer to be 25% of its maximum value while observing it’s graph on the oscilloscope. We measured Vout and then divided it by Vin of 1V (set by the function generator) to calculate the gain. We then repeated this to 25% to 50% and 75% of the maximum resistance of the potentiometer to observe its effects on the output of the oscilloscope. We noticed that at 75% of its maximum resistance the filter behaved like a band pass filter while at 25% it behaved like a band reject filter, due to the gain increasing at higher and lower frequencies at 25% while doing the opposite at 75%. We then repeated this round of measurements with 2 different sets of capacitors, the first being C1= 0.0022 µF and C2= .022 µF (at 1 kHz) then C1= 560 pF and C2= .00562 µF.
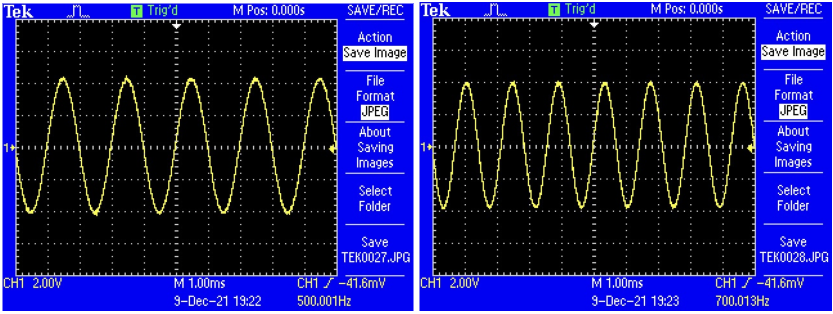
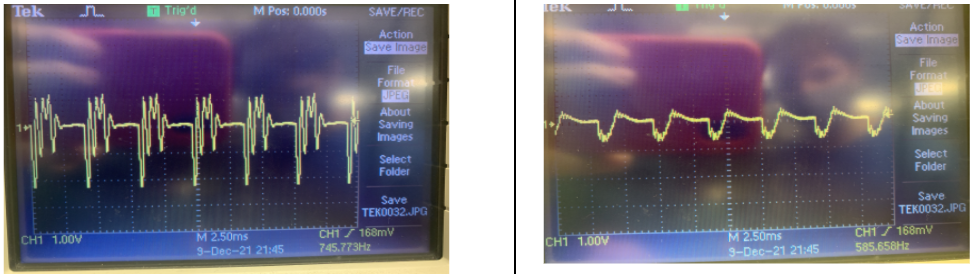
Figure 1. Oscilloscope readings for circuit with center frequency of 250 Hz
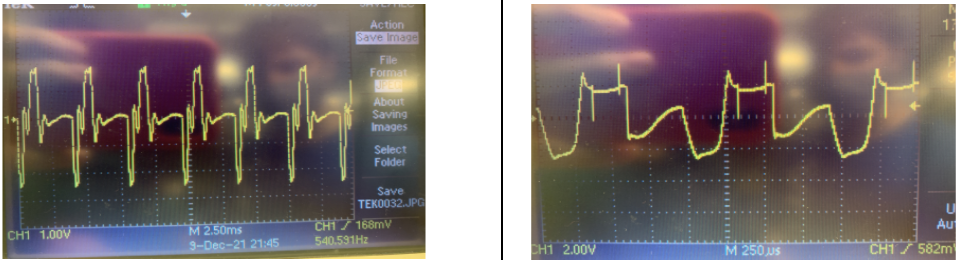
Figure 2. Oscilloscope readings for circuit with center frequency of 1000 Hz
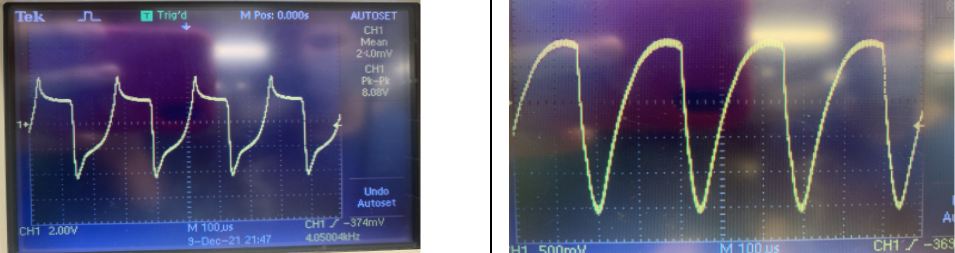
Figure 3. Oscilloscope readings for circuit with center frequency of 4000 Hz
Figure 4. At 250 Hz with potentiometer at 25%, 50%, and 75%
Figure 5. At 1000 Hz with potentiometer at 25%, 50%, and 75%
Figure 6. At 4000 Hz with potentiometer at 25%, 50%, and 75%
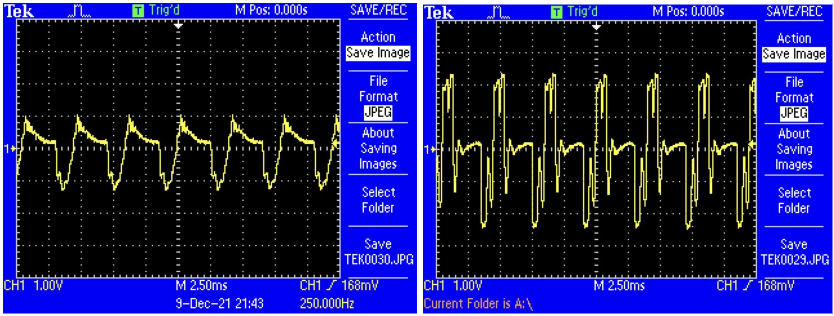
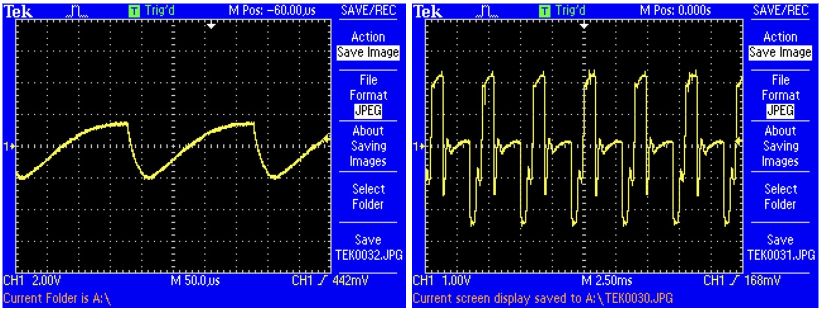
For the second part, we combined op amp circuits from the previous three labs to build an audio mixer. After building and combining the filters and amplifiers required for the mixer, we tested the functionality of each filter by changing the potentiometer resistances in each filter / amplifier at a certain frequency. After getting a sense of how each circuit affects the output signal, we varied the frequency to see its effect on the output waveform. We set the amplitude of our input signal to be 1V to avoid having an output signal amplitude that exceeds the VCC and VEE, and to keep the calculations simple when solving for gain. The images of the waveforms in the left column have all three potentiometers in the filter circuits set to 50% resistance and the potentiometer in the equalizer summing amplifier set to high. We could change the summing one up or down to see the effects on the output. The images in the right column correspond to each given frequency and have a different waveform after changing the resistances in the potentiometers. One thing we did improperly in this part of the lab is that we also changed the potentiometers in the filters as well, which can be seen in the smoother waveform in the right column. However, it is also apparent that the potentiometer in the equalizer summing amplifier controls the overall amplitude because the overall amplitude shrunk and rose as we lowered and raised the potentiometer value.
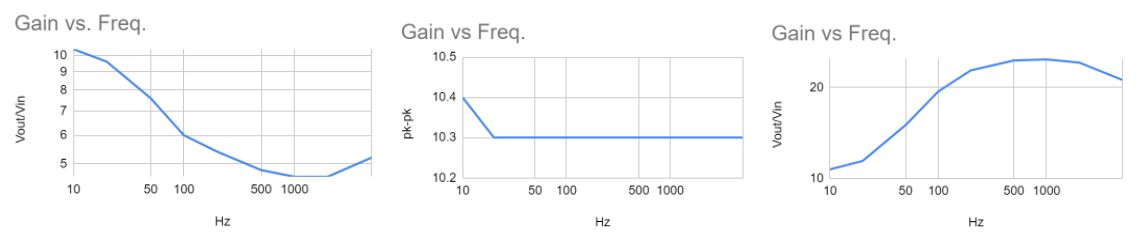
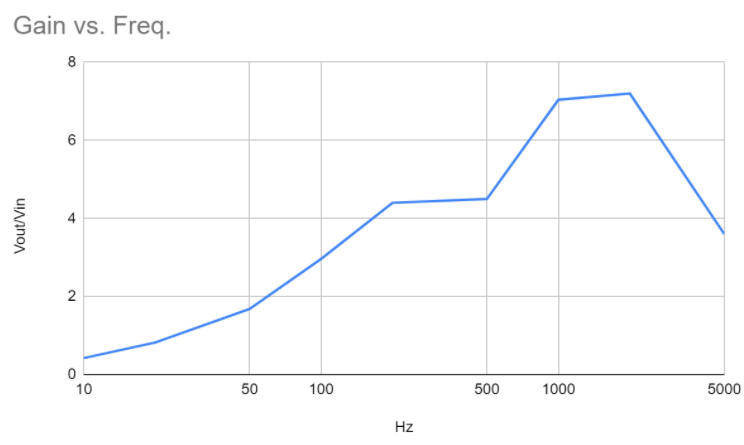
To plot the gain of the audio mixer, we used the function generator and AC sweep method again because it is a familiar process from previous labs and because the spectrum analyzer was being used by other groups. We measured the peak-to-peak voltage as the response to changing the frequency of the input from 10 Hz to 5 kHz.
Figure 7. Output waveform at 50% filter pot. resistance (400Hz), output after lowering the potentiometer
Figure 8. Output waveform at 50% filter pot. resistance (1kHz), output waveform after lowering potentiometer resistance
Figure 9. Output waveform at 50% filter pot. resistance (4kHz), output waveform after lowering potentiometer resistance
Figure 10. Gain vs Frequency plot of audio mixer
Errors in the lab can be caused by the inaccuracies and rounding in an oscilloscope. In addition, the voltage and phase shift readings became increasingly rounded when we entered the micro- and nano- ranges. Also doing the AC sweep instead of using the spectrum analyzer could have affected our results.
Due to the complexity of the circuit, there can be many sources of error from circuit components. One source can be from non-ideal values of capacitors and resistors. When we were using the multimeter to determine capacitance values, we noticed the actual values were off from their ideal values. For example, our .1 µF was .077 µF. Similar case was for the resistors. Another error involving the physical circuit components is that we had to manually measure and change the resistance within the potentiometer. The errors listed so far affect the quality of the outputted sound from the speaker and the response with varying frequencies (4.2 question 6). Another source of error could be that we wired a circuit incorrectly. We might have calculated and chosen a wrong capacitor value for the filters. We suspect that this could be the case because we had to borrow a capacitor from another group because we did not have enough.
Conclusion
The main purpose of this lab was to get more familiar with active filters and be able to combine circuits we have built in the past 3 labs to form something of practical application, which was an audio mixer. Also, this lab allowed us to get better at troubleshooting, as the audio mixer had a lot of wiring. We were able to see how changing the value in the potentiometers in the mixer altered the sound of the output, as it created different filters due to the gain changing. Also, when adjusting the potentiometers for the filters in 4.1, we saw that at lower resistances it would act like a band reject then as resistance increased, the filter acted more like a band pass. In the audio mixer, we had three signals coming in, one was from the microphone and the other 2 were our own devices. We noticed that the loudness of each source coming out of the speaker changed depending on the the values of the potentiometers in the summing amplifier. If done again, we would also use the Spectrum Analyzer to plot the gain of the band pass and reject filters, since we had originally done it with the function generator and oscilloscope. All in all, this was a great project to learn about the properties of filters and see the outcome in a practical setting.