This tutorial shows how you can use Wekinator to perform regression analysis to compare variables.
This guide will help you learn how to use the regression explorer feature in Wekinator. It’s a program made in Processing that works with Wekinator to show you how different regression algorithms work.
First , we’ll use the neural network, inputting a few tests for the model to run.
After programming, the feature will draw the regression line. Similarly, we will use the polynomial and linear regression to see how the lines will look.
What is Regression Analysis?
Regression analysis is a powerful method that allows you to examine the relationship between two or more variables of interest.
There are many types of regression analysis, and they all are used to examine the influence of one or more independent variables over the dependent variable. We’ll use different regression models and observe their behavior.
The use of regression analysis provides detailed insight that can be applied to further improve products and services.
How to Setup Processing
The regression explorer is made in Processing and is available on the Wekinator website.
It will accept one input from Wekinator and provide one continuous output from Wekinator.
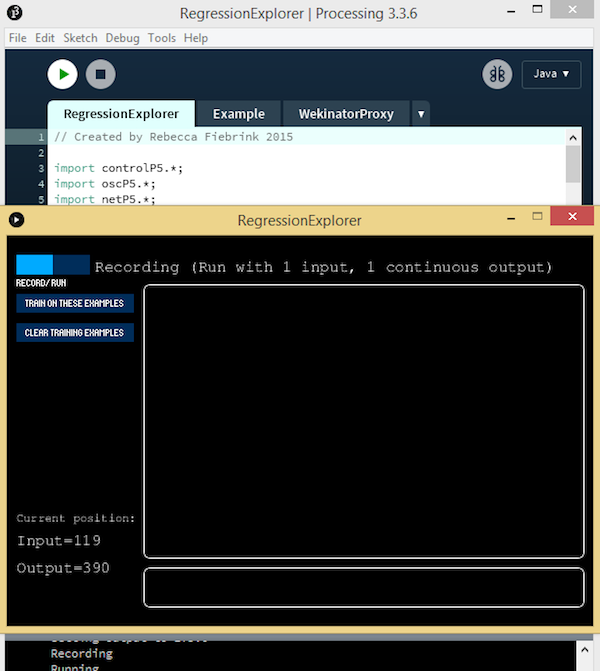
Once the ‘Regression Explorer’ file is downloaded, unzip it and run the sketch in Processing.
Download the Regression Explorer file for Processing.
Setting up Wekinator
Wekinator will receive one input and send one continuous output to Processing.
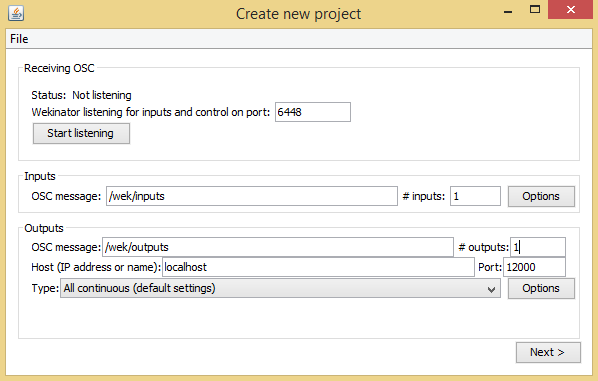
Open up the Wekinator platform, and set the inputs and outputs to one and leave the output type to the default “all continuous.”
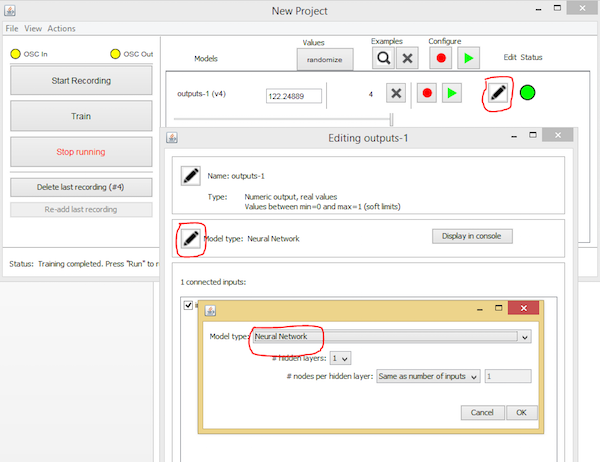
Fill out the "create new project" window to mimic the settings in the image above.
Click “next” to open up a new Wekinator window.
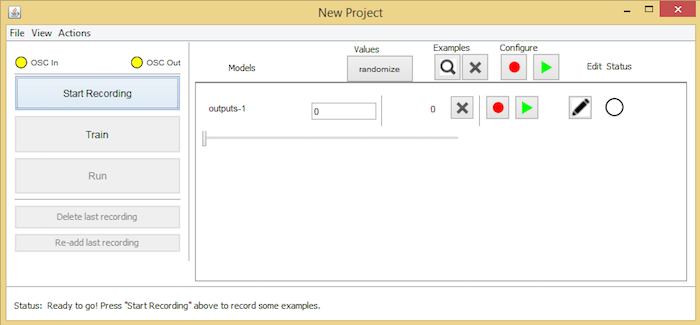
The new project window in Wekinator.
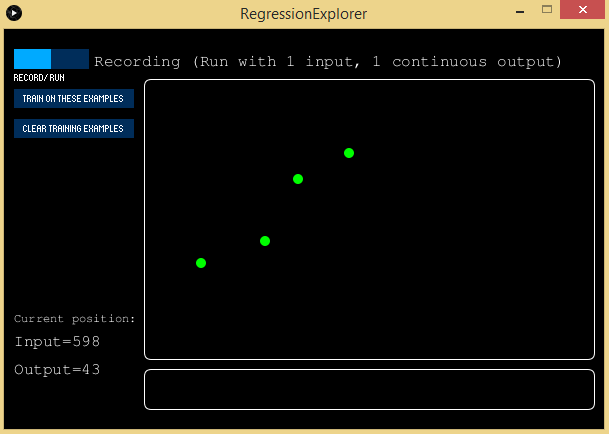
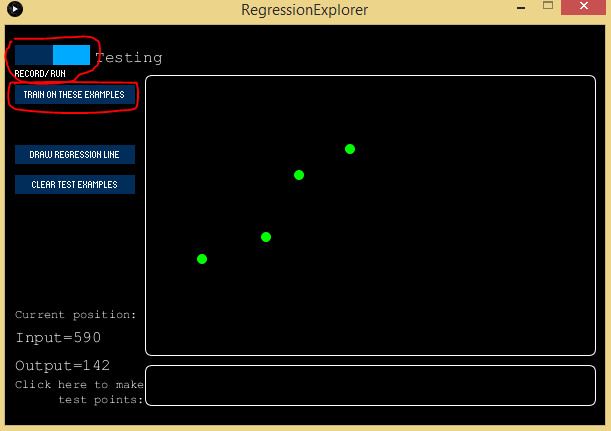
Now go back to the Regression Explorer and provide inputs which will train the Wekinator to give us the appropriate outputs. Give as many examples as you want from the regression explorer. In my case, I gave four examples.
Next, we need to train the model with these examples. Select “run” and then select “train on these examples.” The model will be trained according to these examples.
Click run and train on these examples.
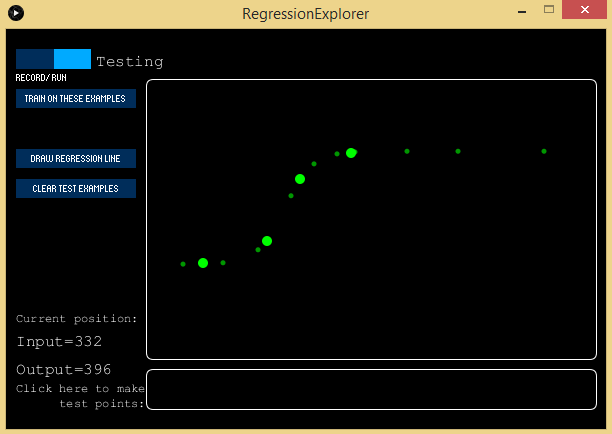
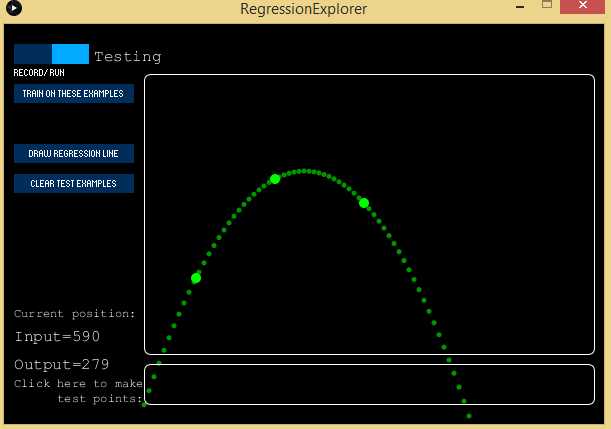
Now that our model is trained, we can make the test points to see how the output will look. Select the bar at the bottom and it will tell you how the output should look at this point.
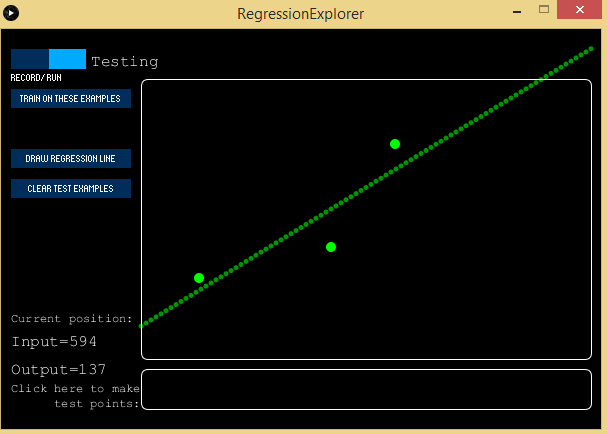
To see the complete output select the “draw regression line” button and it will draw the regression line. The algorithm we are currently using is the “neural network” , but you can change it to “linear/polynomial regression.”
Next, clear the test examples and input different examples to continue the training. Train on these examples and select “draw a regression line”. Now it will draw an appropriate linear line according to the samples. Similarly, you can draw a polynomial line by changing the output to the polynomial.
To draw a polynomial line, clear test examples and input some more new examples. Train on these examples and click on “draw the regression line.” This time it will draw a polynomial line.